Updated self-service statistics page
1662020981021
Improvement
We have updated the self-service statistics page to better visualize self-service volume by flow type, and interactions fully automated by self-service or served by an agent after self-service.
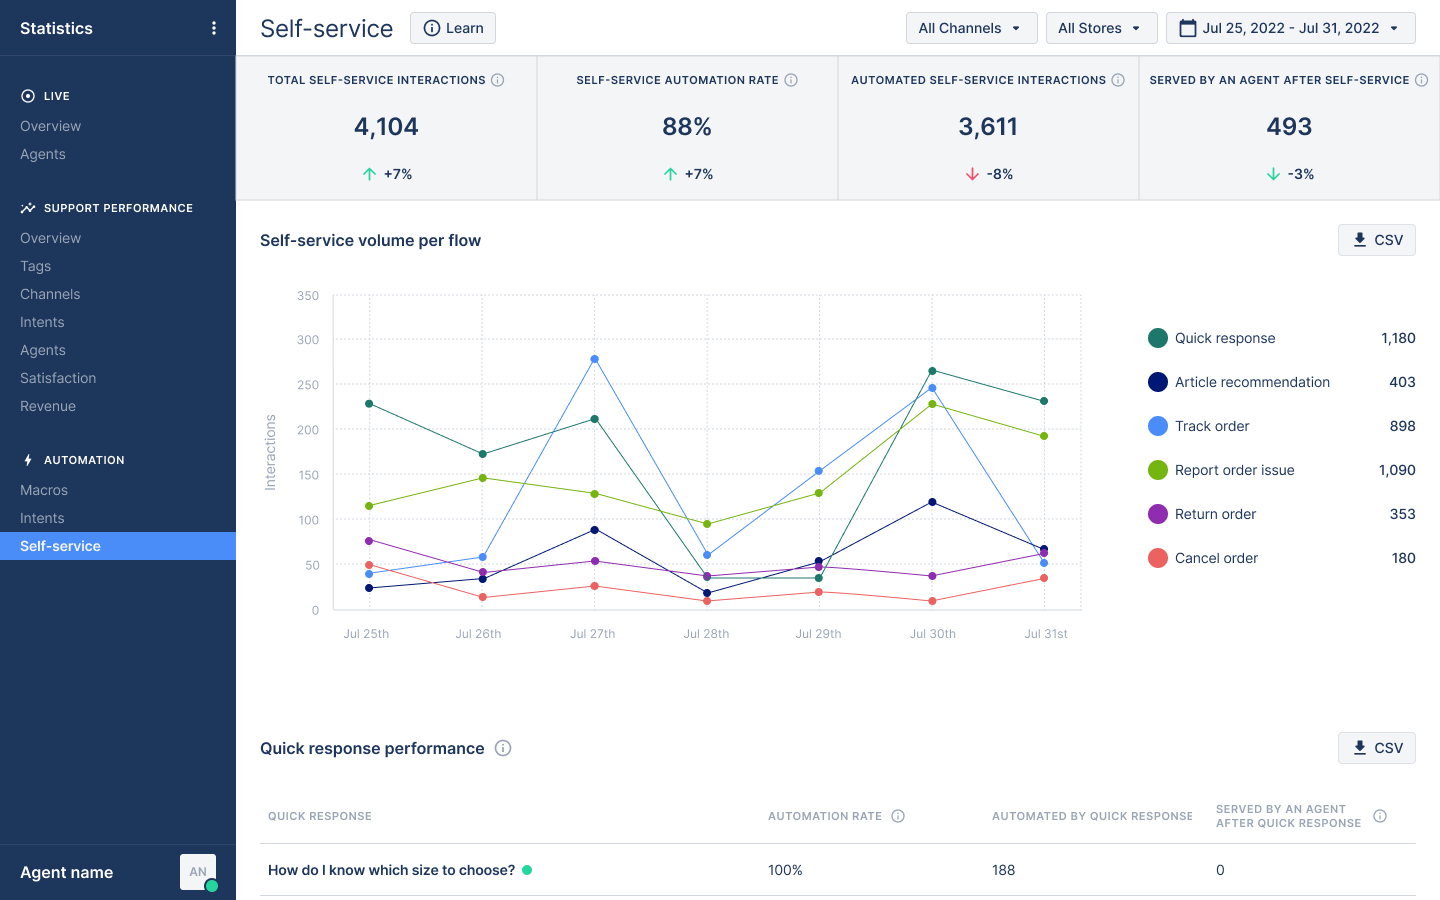
You can now find self-service volume per flow in a new line chart, as well as data on quick response performance, article recommendation performance, top order issues reported by shoppers, and products with the most issues and return requests. The high-level overview metrics have also been simplified.
This page is accessible for all customers that are subscribed to the automation add-on.
Did you like this update?
![]()
![]()
![]()
{error_message}
Leave your name and email so that we can reply to you (both fields are optional):
Thanks for your feedback!
Published by Marwan Sentenac