📊 Revamped Tags report and other Statistics Improvements
1729182165658
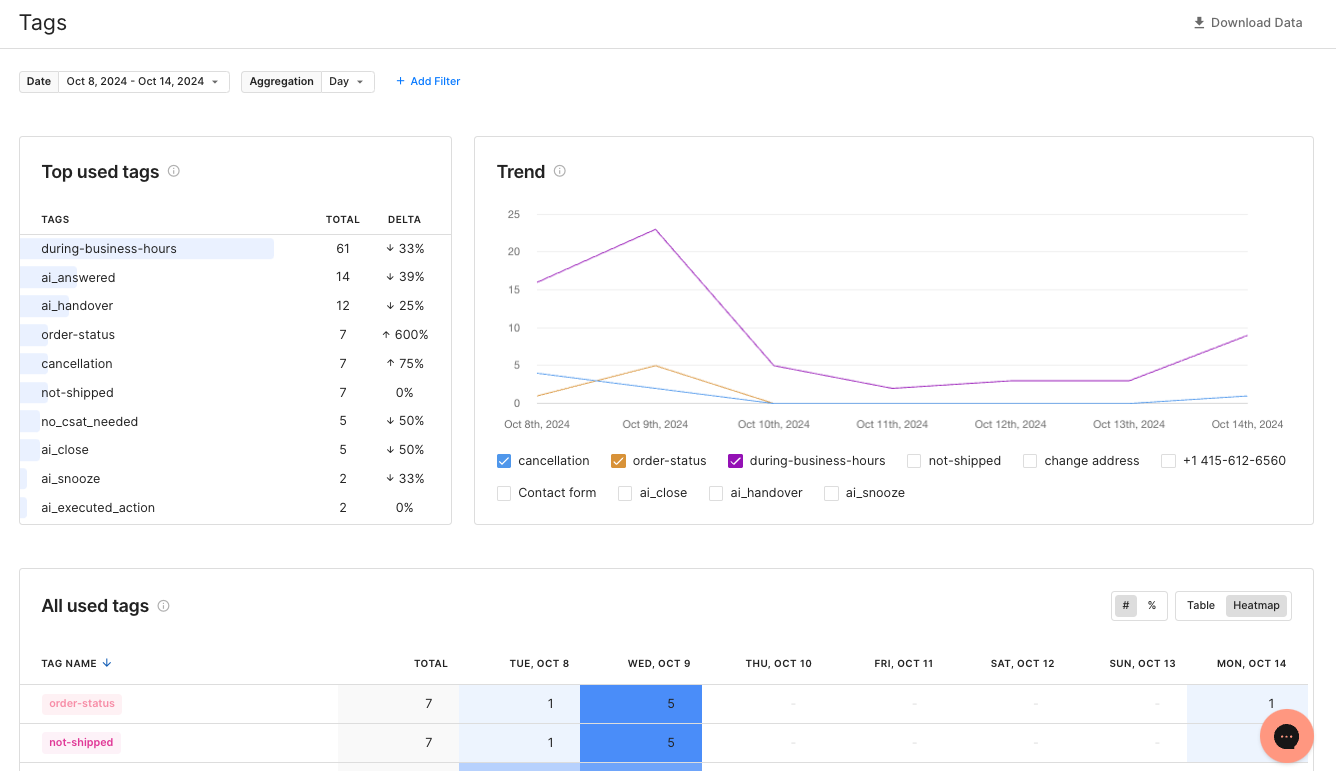
A revamped Tags report 🥁
We have revamped the Tags report to bring the best of our new analytics stack:
Aggregate data over up to 365 days.
Use all the new filters (agent, Ticket Fields, etc.).
Check the evolution of your tags over time thanks to the
TrendChart.
A couple of things to note:
The usage counts may differ slightly between the new and legacy reports:
The new version shows "The number of tickets tagged with a certain tag during the period (regardless of the ticket creation date)."
The legacy version showed "The number of tickets created during the period that have been tagged with a certain tag (regardless of the tagging date)."
The meaning of 'Percentage' differs:
In the new report, the
%represents the distribution of used tags during the period, regardless of when the ticket was created. The total is equal to 100%.In the legacy report, the "Percentage" column showed the % of tickets created during the period that have a given tag (the total of the column could be over 100%).
Other notable improvements:
We have introduced the
Aggregationfilter, allowing you to change the aggregation window in reports featuring graphs over time. Choose fromday,week, ormonth.You can now add the
Tagfilter multiple times, allowing you to combine Tags in more complex ways. For example: Assuming you want to include all tickets from your VIP clients but not the marketing tickets sent to them, you could now add the following two filters to your reports:Tagis one ofVIPTagis not one ofmarketing
Did you like this update?
![]()
![]()
![]()
Leave your name and email so that we can reply to you (both fields are optional):