Meet the fresh new Gorgias Automate Statistics ✨
1707224395772
We're thrilled to introduce a significant upgrade to your Gorgias Automate experience. 🎉
We completely rebuilt Automate Statistics to offer more robust reporting and helpful insights. Furthermore, we've adjusted the reports, introducing two distinct ones: "Statistics Overview" and "Performance by Feature." This update is geared towards offering more ROI metrics and perfectly aligned with our revised automation rate calculation. Enjoy the improved features.
Here's what's coming your way:
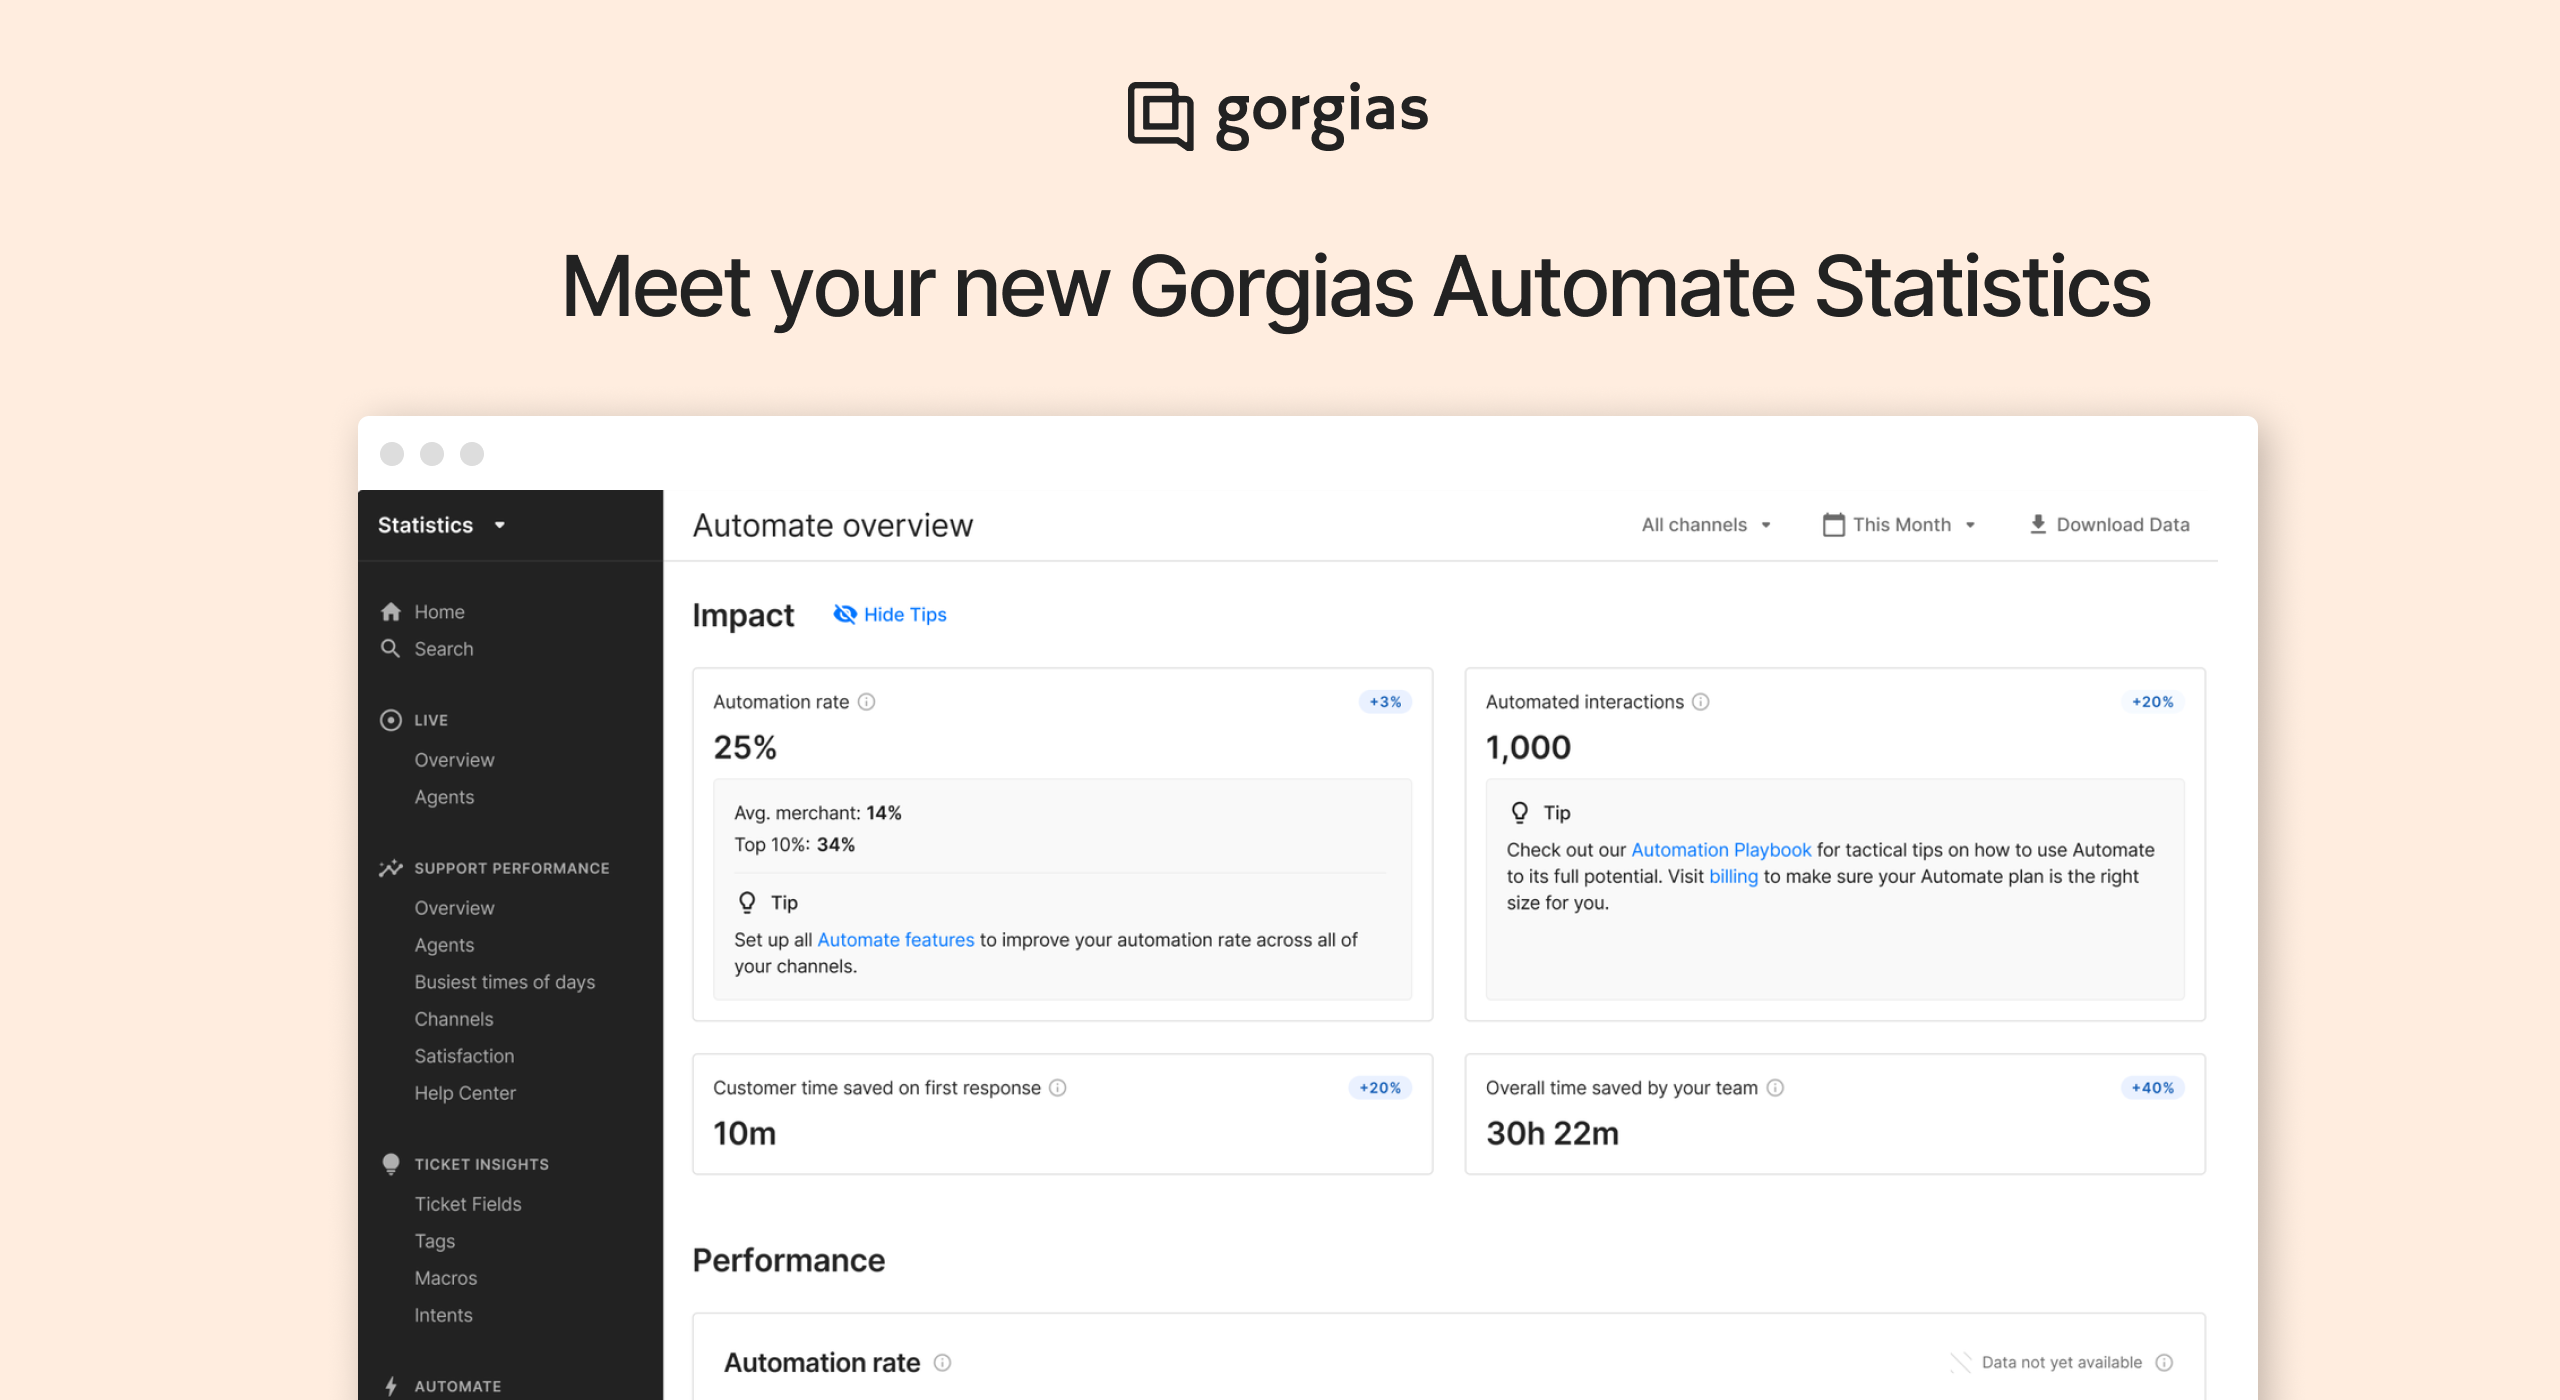
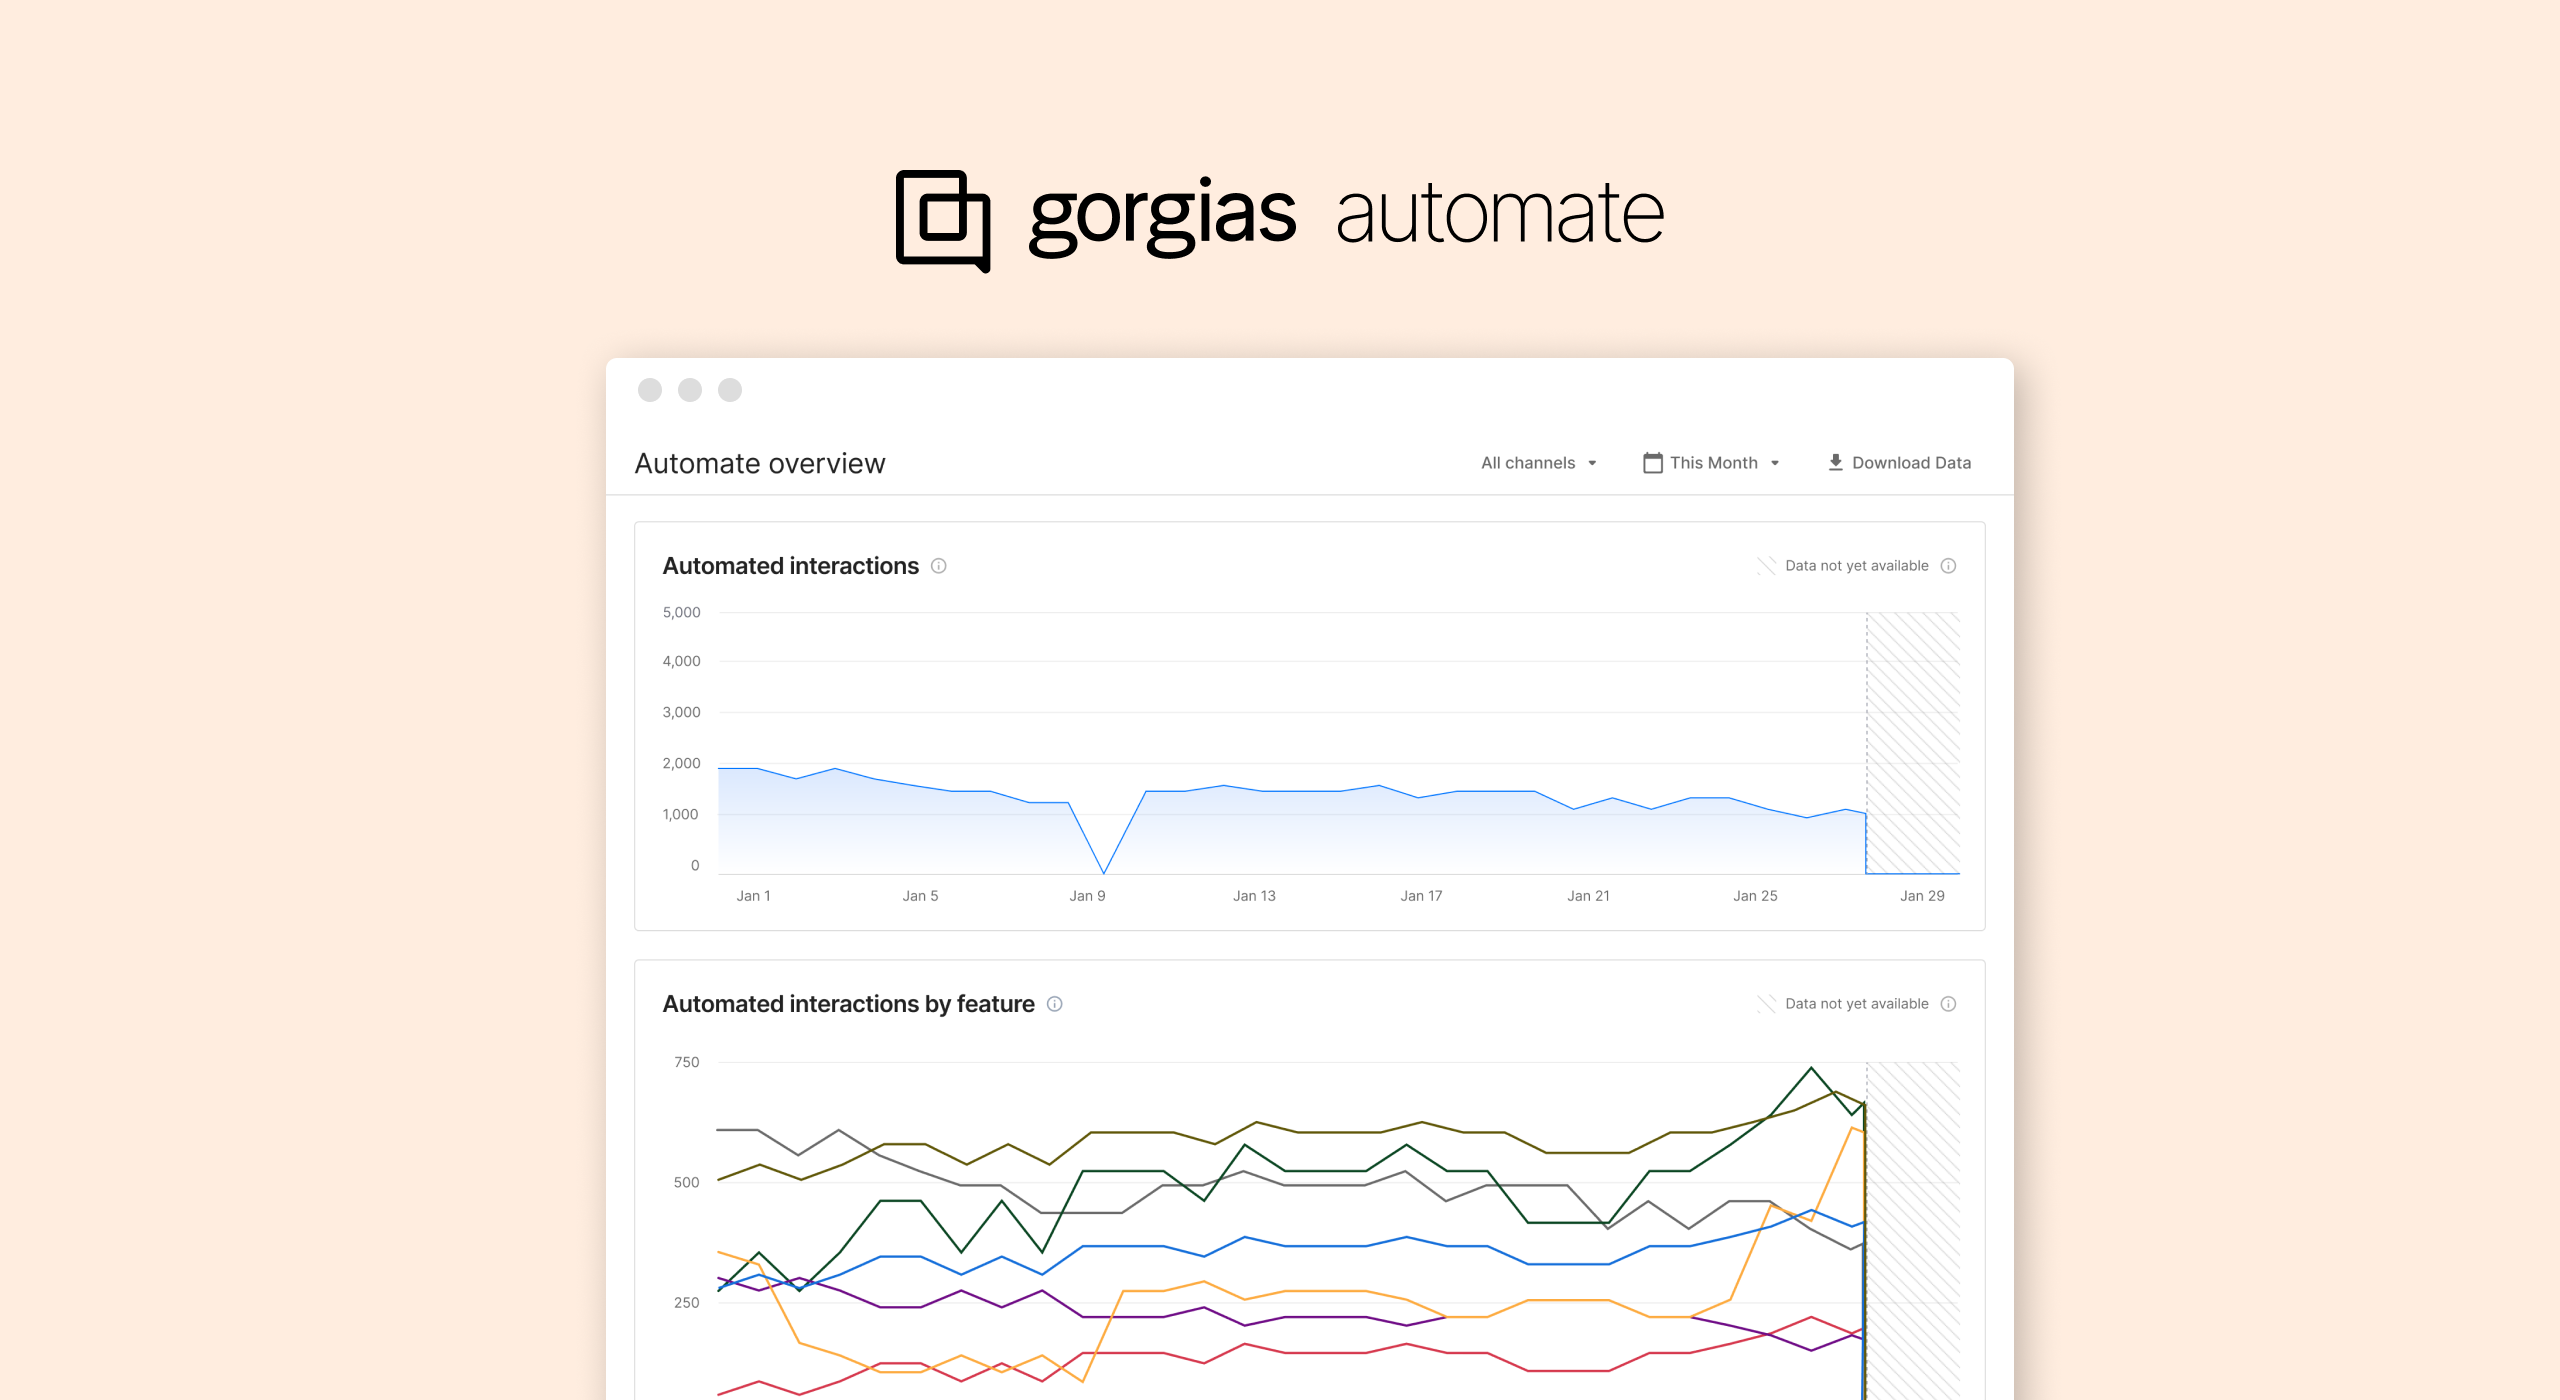
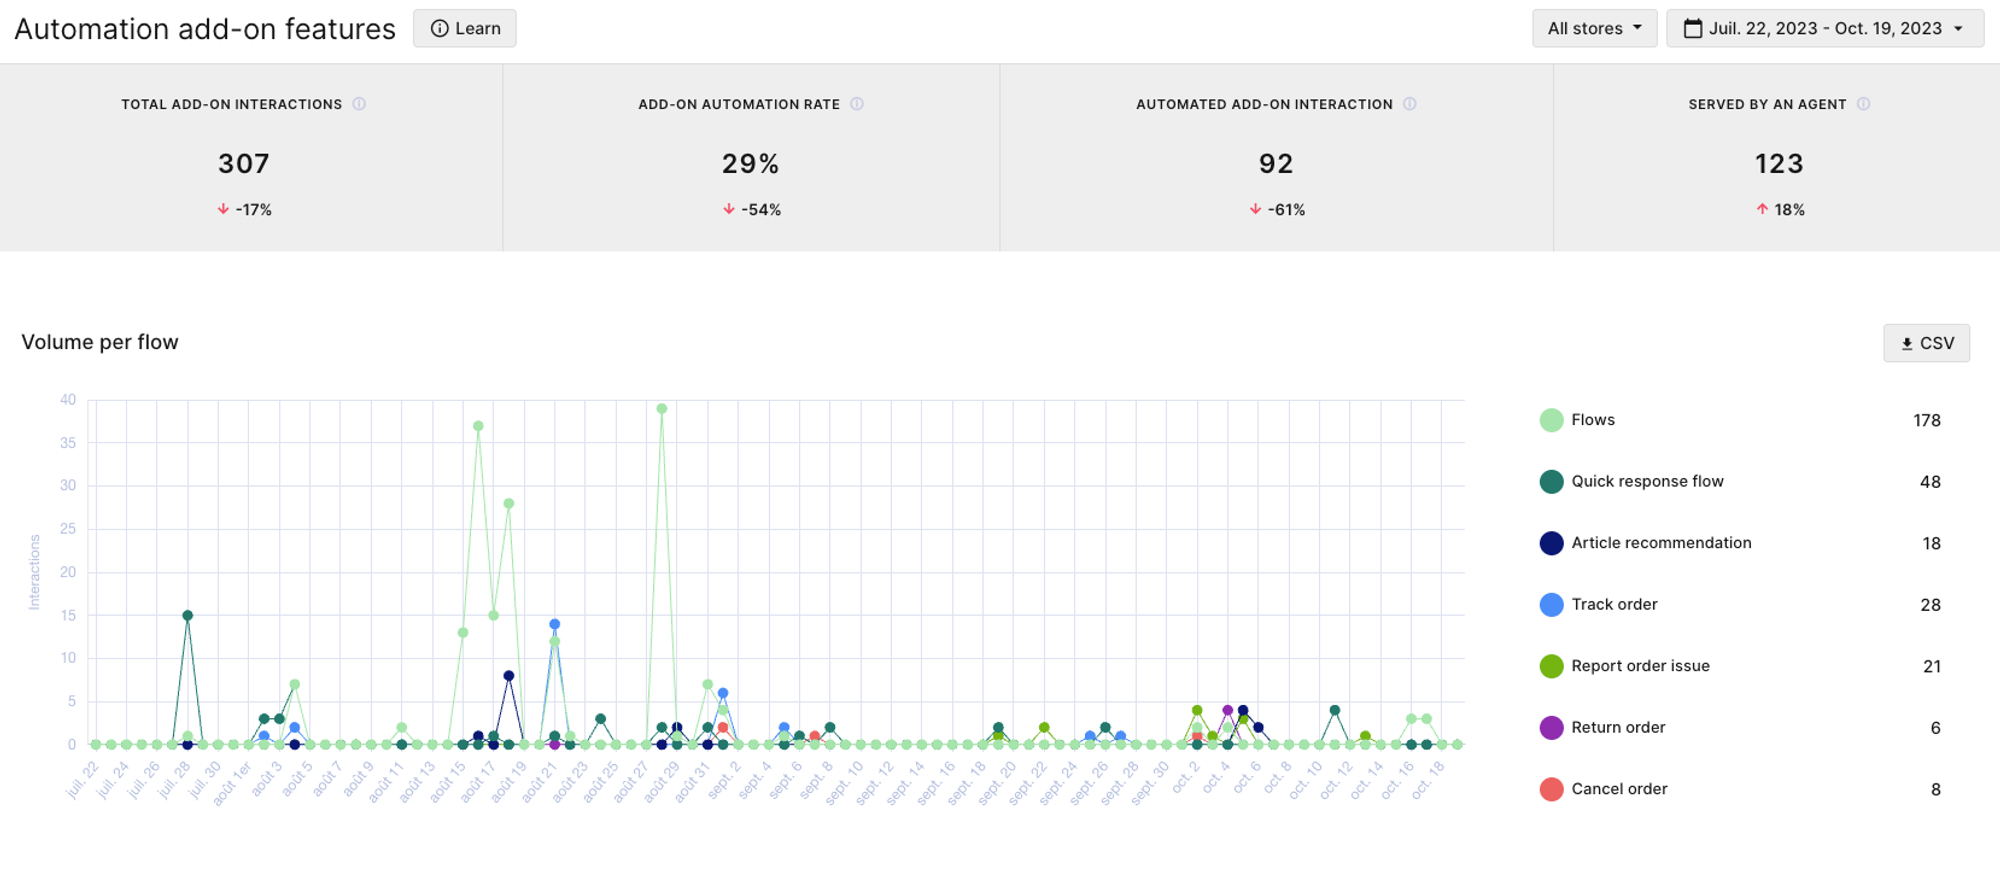
Automate Statistics Overview: Understand Automate’s overall impact on your company
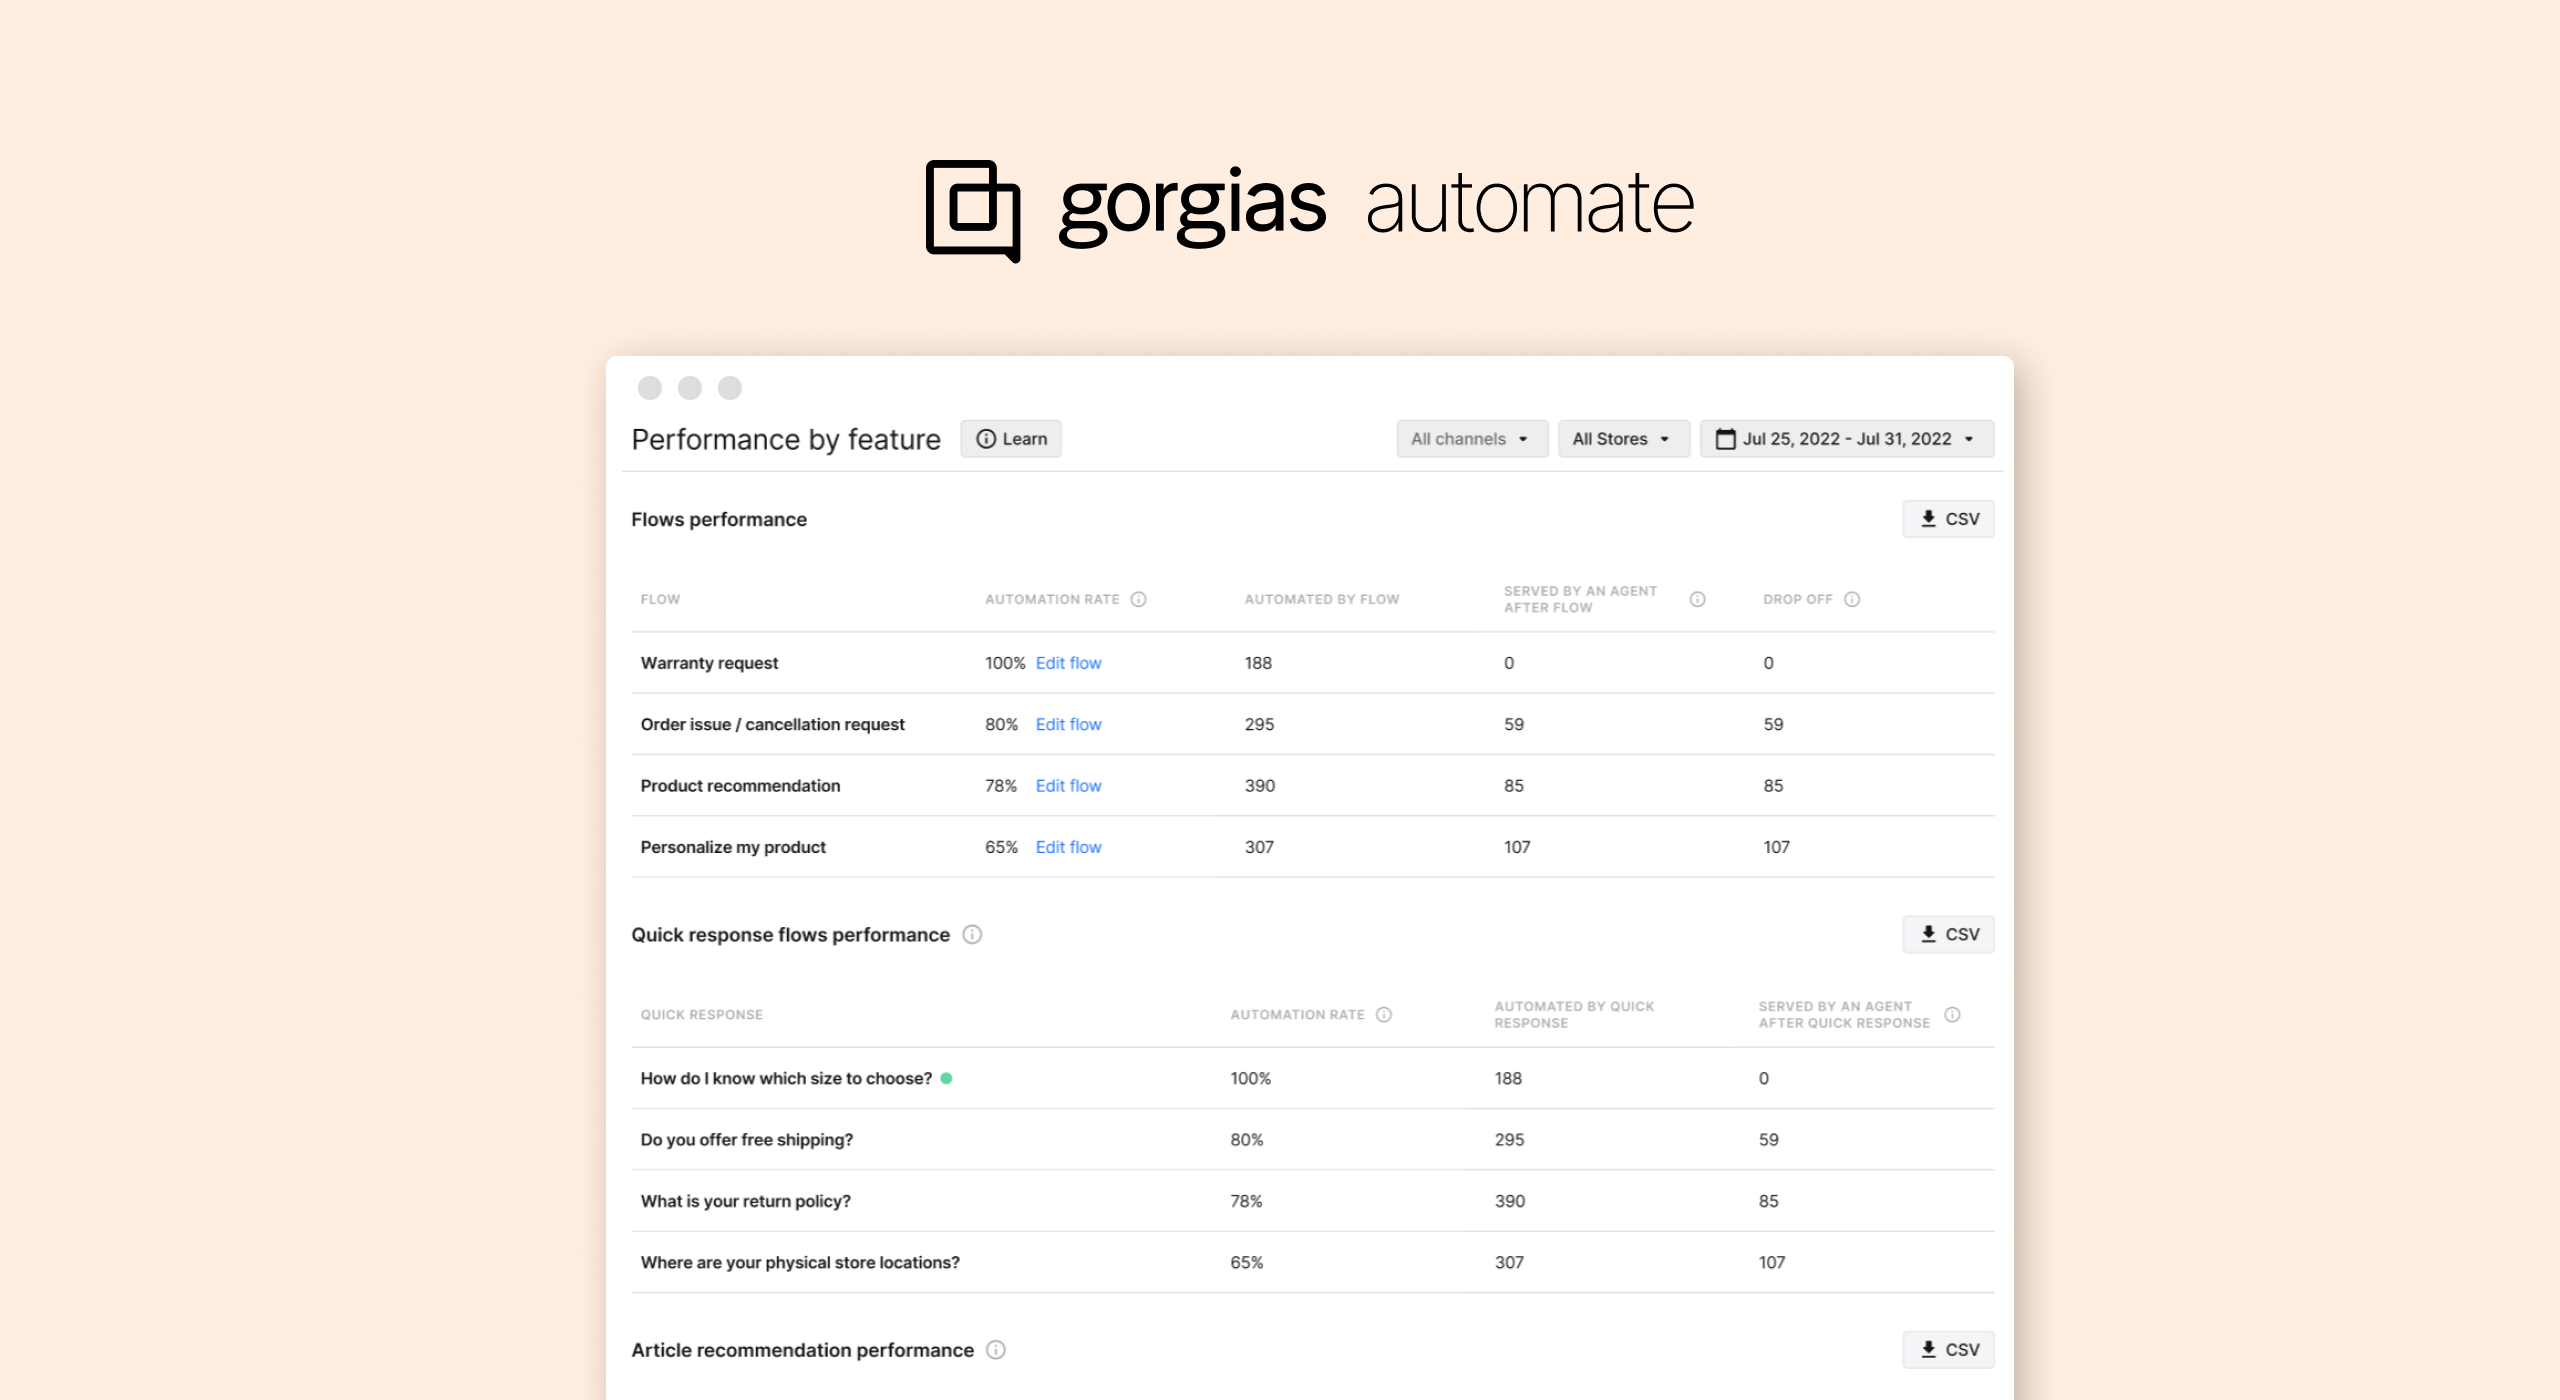
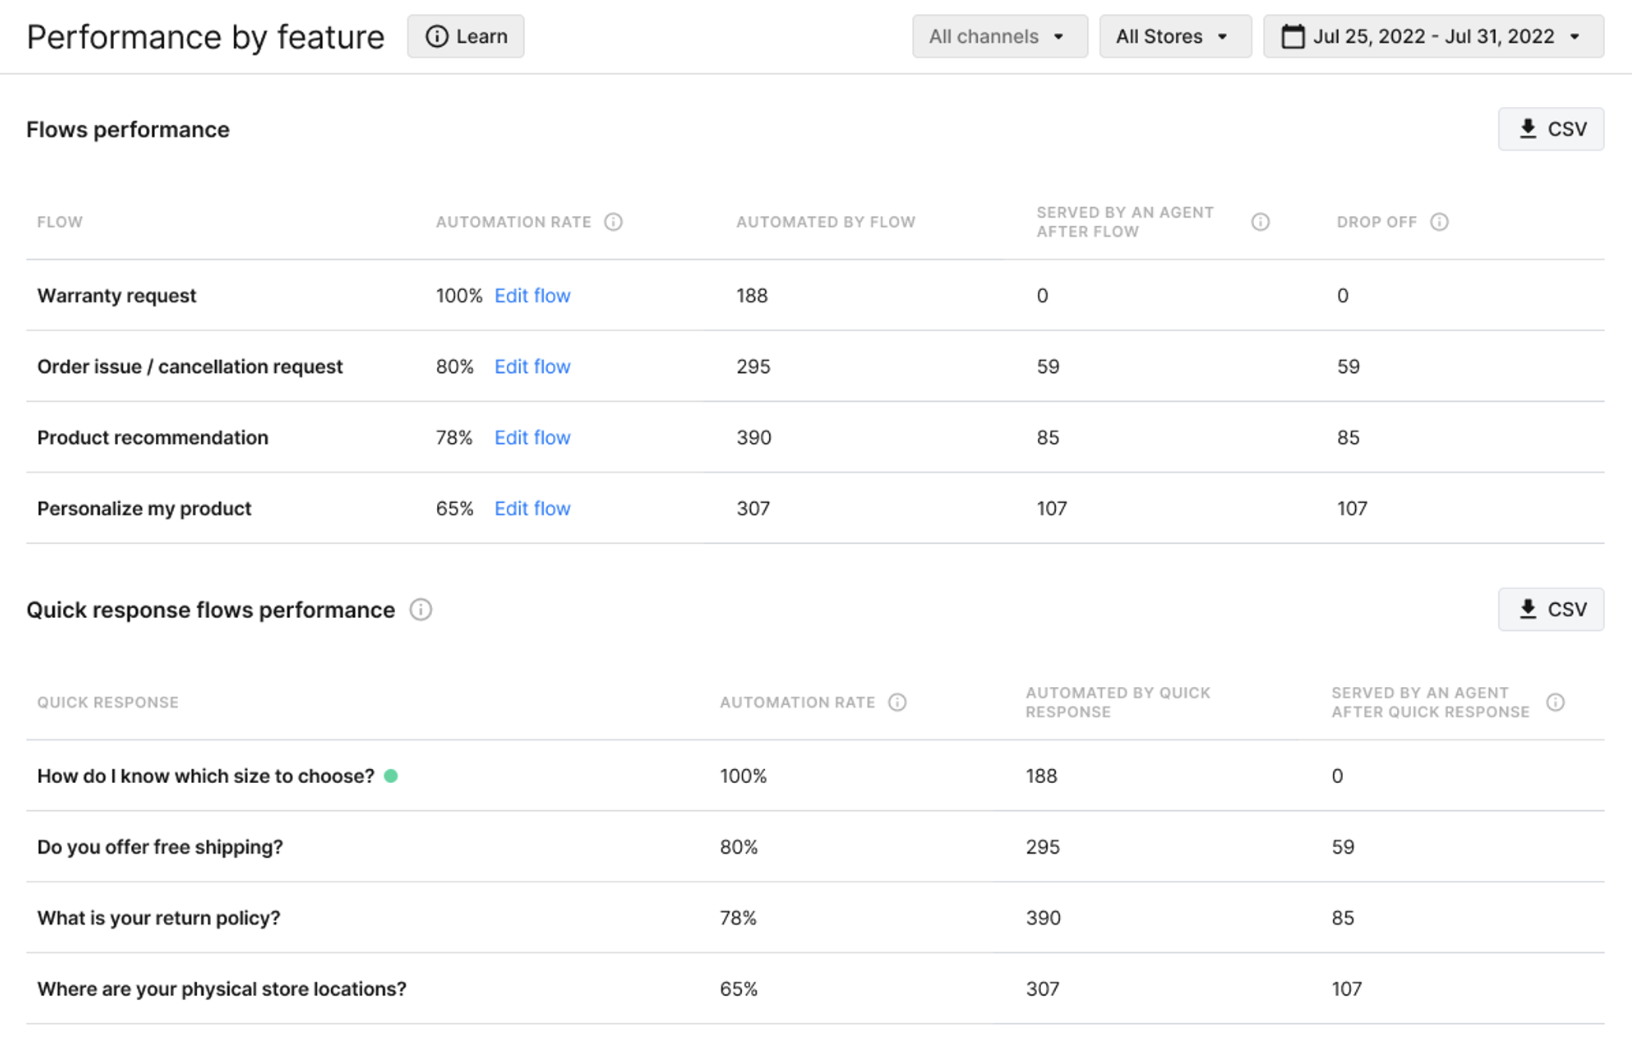
Performance By Feature: Drill down to measure and improve
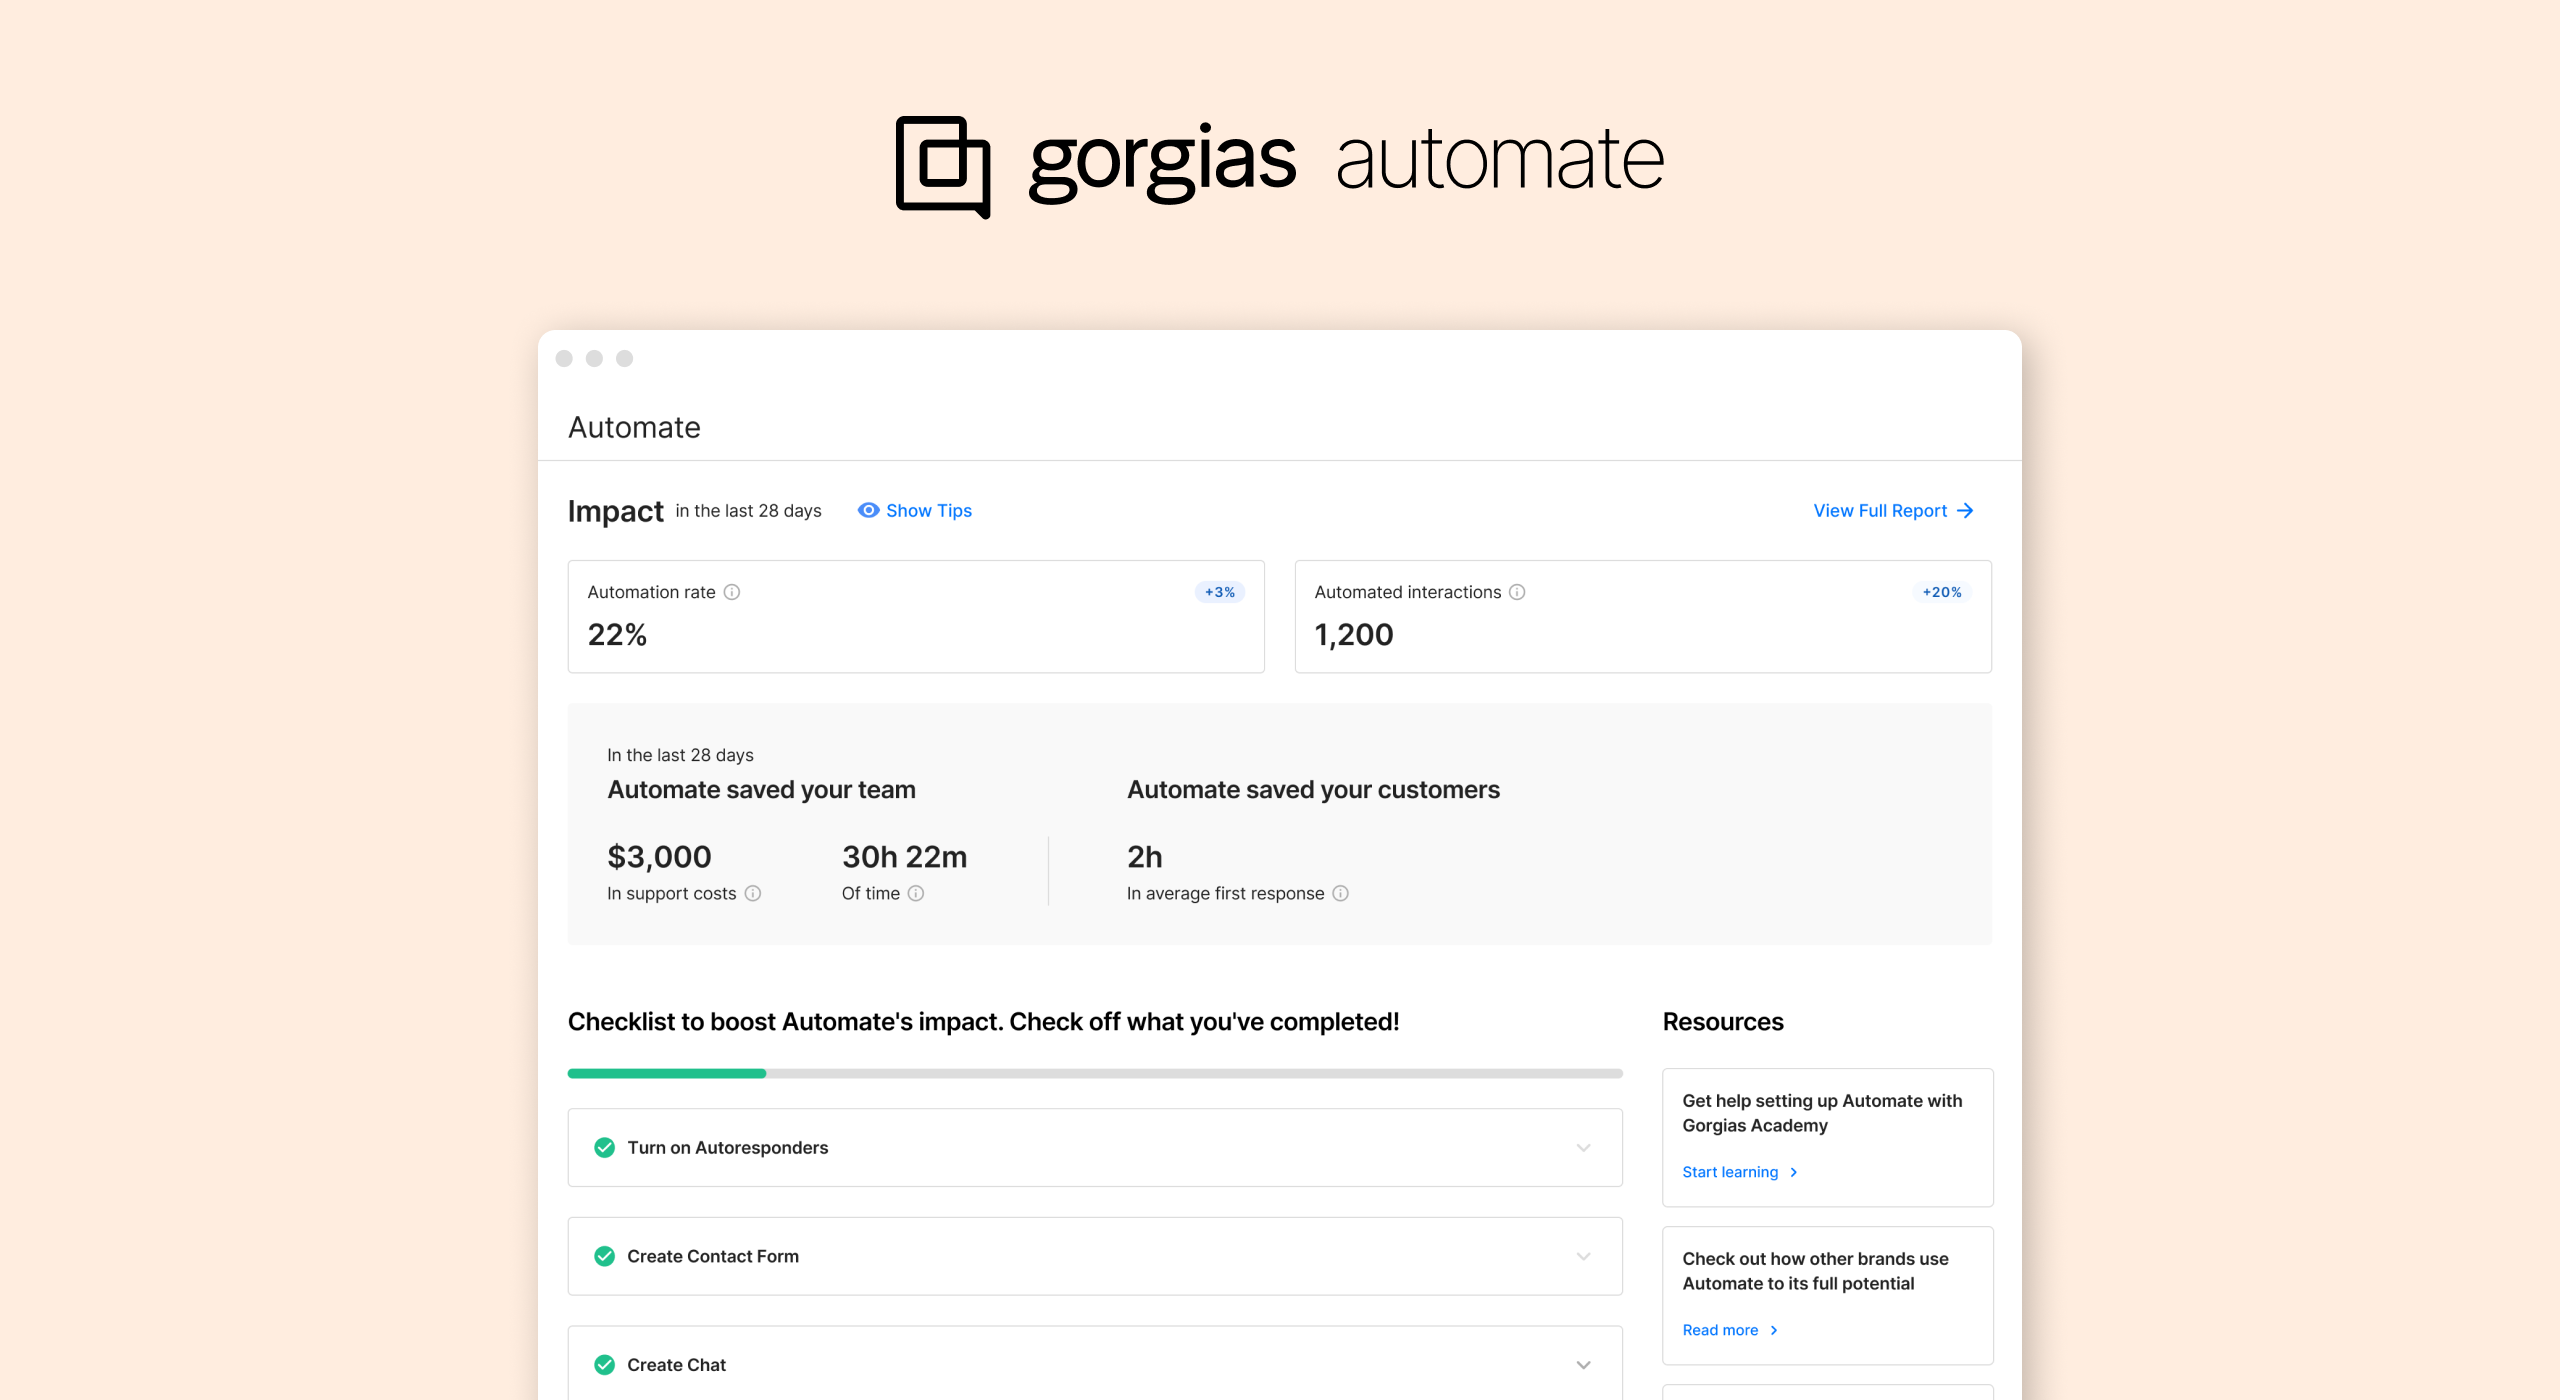
My Automate: Your new home base for all things Automate
🌟 Understand Automate’s impact on your most important metrics
Wondering how Automate is impacting your most important metrics? We got you. Understand your automation rate and all the essential metrics it impacts — time savings, cost savings, and reduction in First Response Time.
🌟 Drill down into each feature’s performance
We’re separating overall impact metrics from the performance of each feature. The Performance By Feature page allows you to zoom in for more granular insights. The data on this page can inform your Automate strategy, letting you know when and how to optimize your Quick Responses, Flows, and more.
🌟 Meet your new Automate home base
On top of Automate Statistics, we’re happy to unveil My Automate. Think of My Automate as a home page for Automate, where you can see the most important metrics at a glance. Plus, you’ll find a handy setup checklist for Automate and other resources to help you optimize your setup.
💡 Why you should start using?
Unlock insights, identify trends, fine-tune strategies, and supercharge your automation game!
Measure the efficiency of your interactions and maximize the return on your automation investments.
Gain a clear view of your costs, ensuring accurate charges for your interactions.
Fine-tune your Gorgias Automate features and product strategy for the best impact using data-driven insights.
💡To recap: What’s different?
1- We've renamed the current report "Overview" to "Performance By Feature," excluding the "Volume per flow" chart. For further details, please refer to the Help docs.
🚫Before
✅Now
2- The Automation Rate has changed: Before, we calculated automated interactions as a percentage of interactions initiated through Automate. We've changed to ensure this metric accurately represents the impact on your entire operation. Please check out more info here.
💡 Do you need to do anything?
No need to worry – our fantastic product team is on it! But you'll definitely want to explore all the details about our updates in our help docs. Learn more by clicking here. 😄
Happy reporting!
Did you like this update?
![]()
![]()
![]()
Leave your name and email so that we can reply to you (both fields are optional):