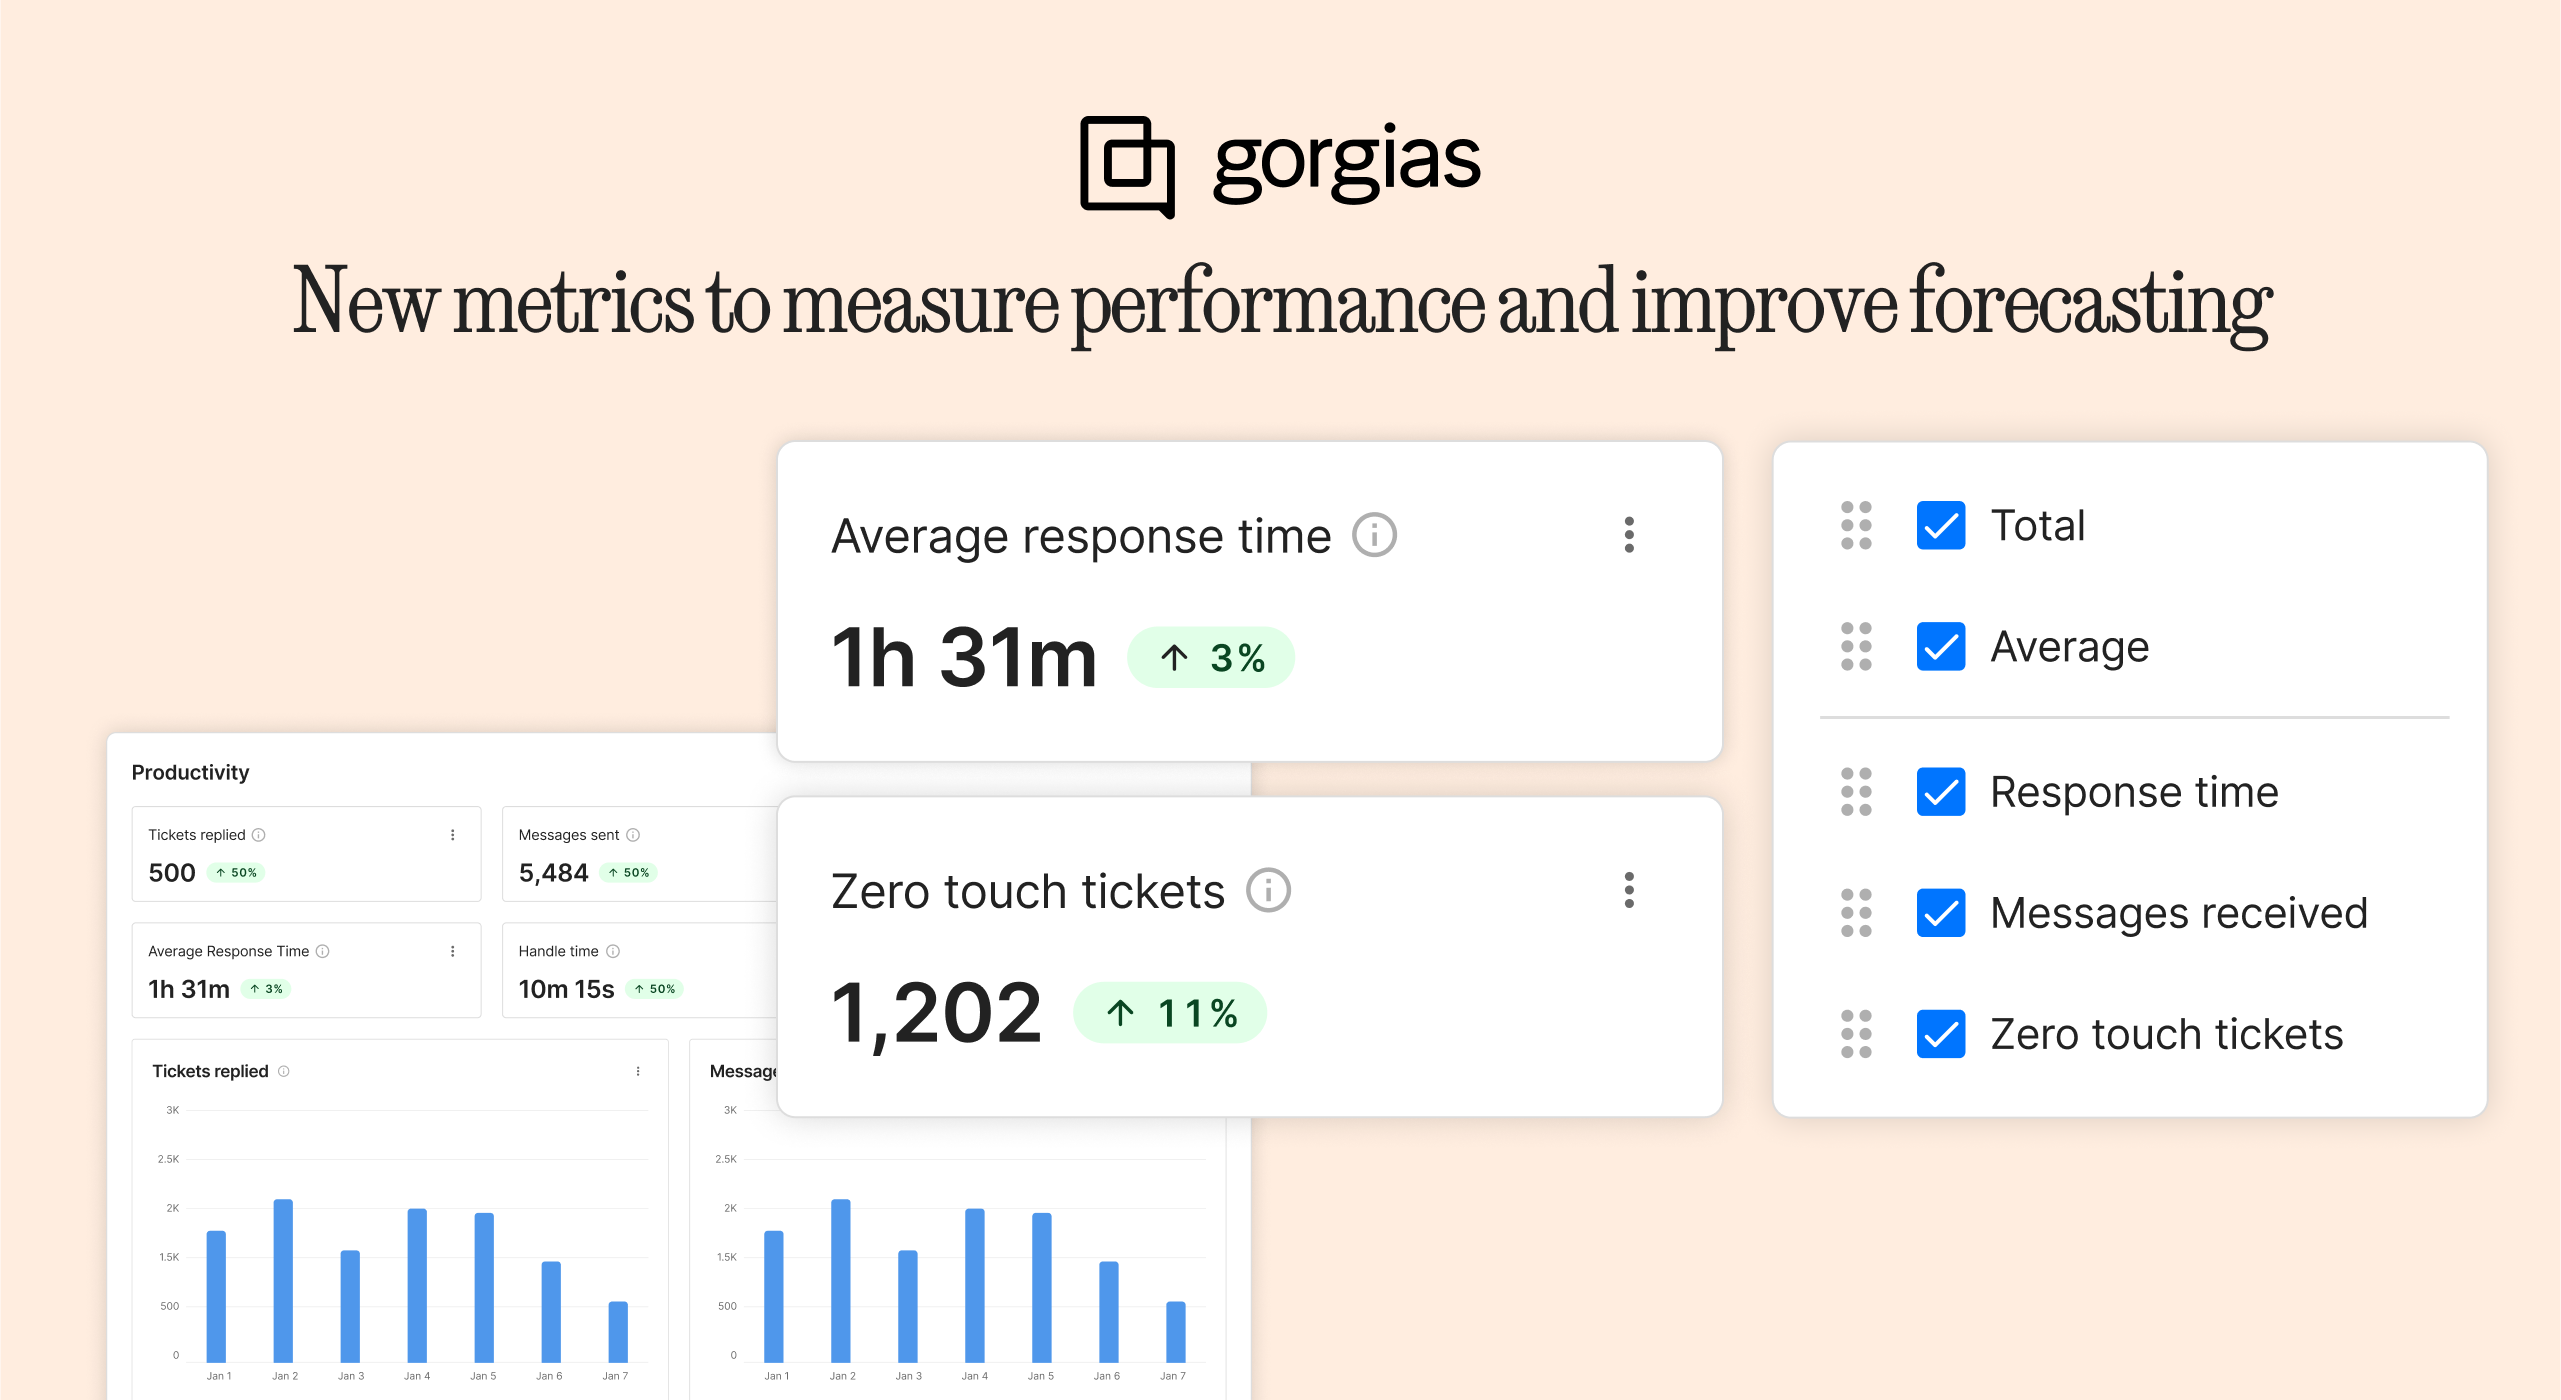
Average response time, zero touch tickets, and more updates to reports!
1742824949383
To excel at your job, you rely on detailed reporting to plan ahead, optimize performance, and prove your impact. That’s why reporting is a priority at Gorgias.
As part of that theme, we’re adding three new metrics, plus the ability to show Total (in addition to Average) amounts in the agent’s report.
Three new metrics
Messages received: See the total number of messages, not just tickets (because a ticket could have 1 or 10 messages). This gives you a better understanding of each agent’s bandwidth and productivity by seeing the amount of work that went into their closed tickets.
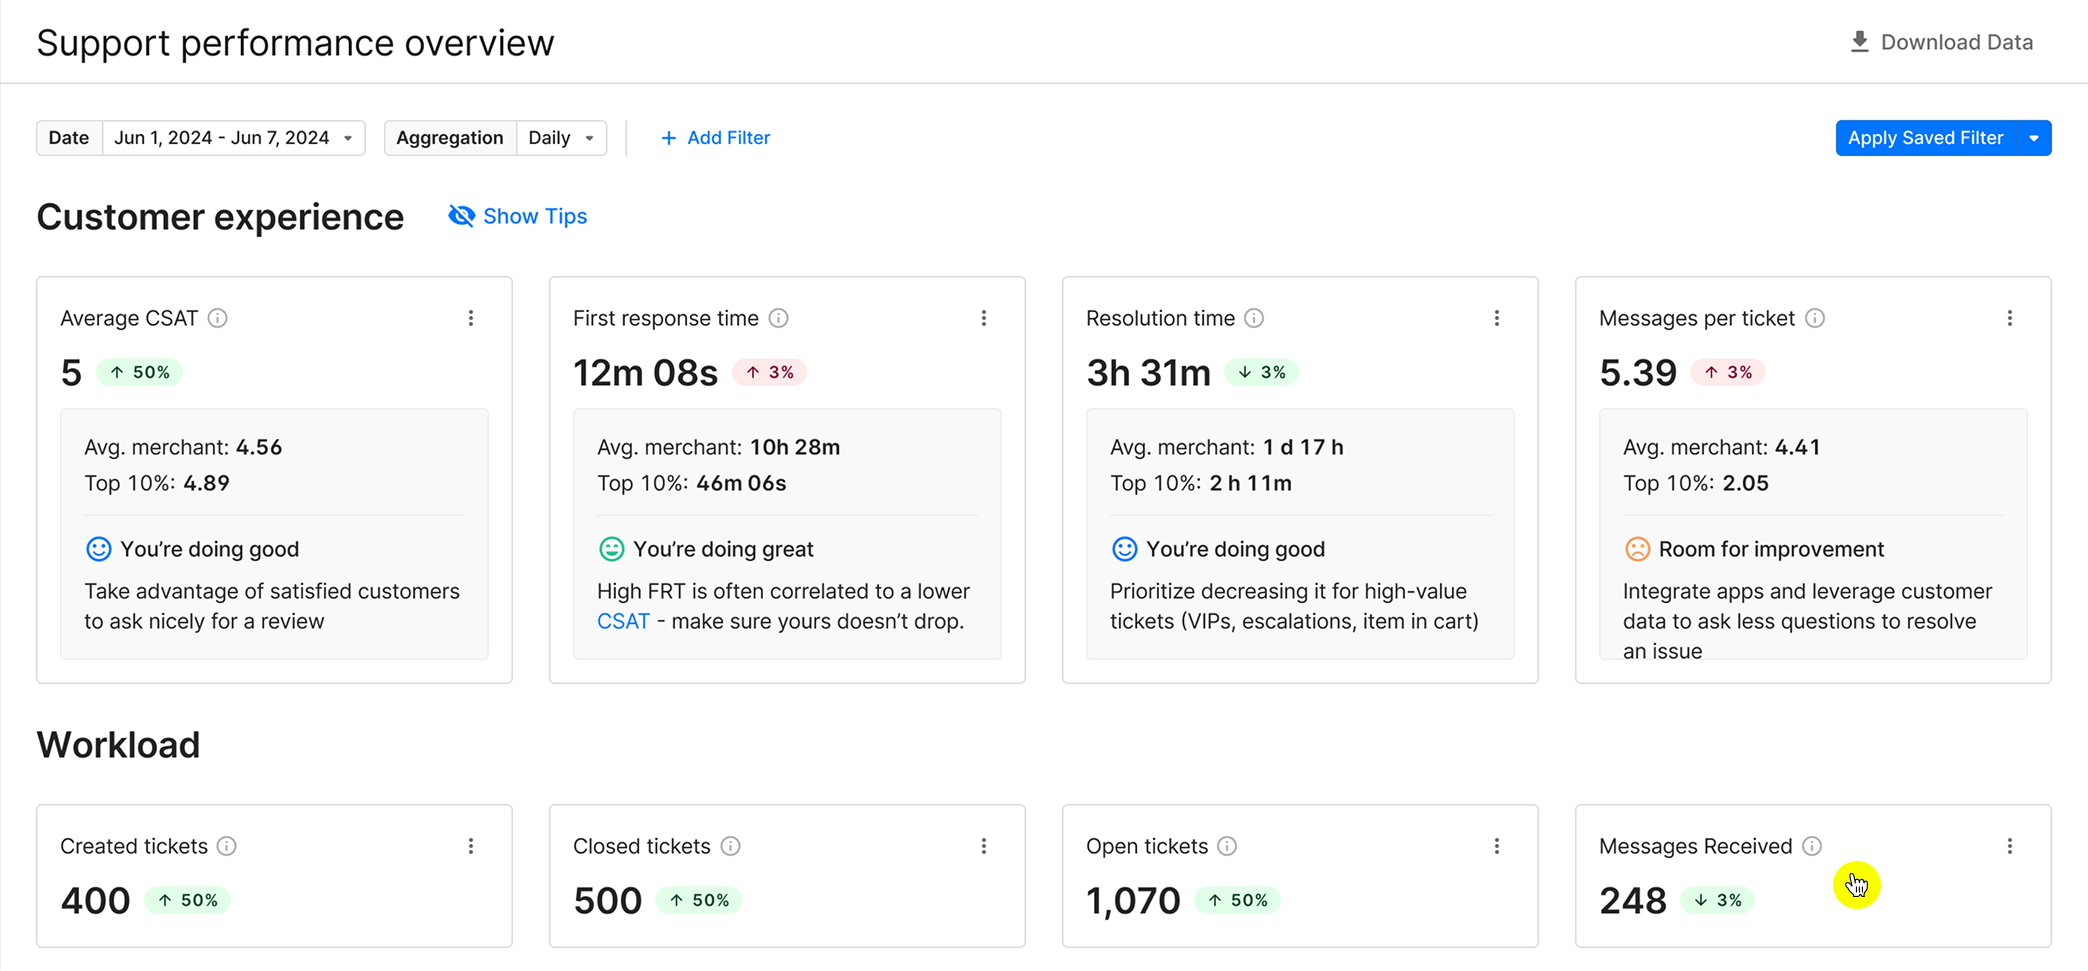
Average response time: Understand how promptly agents are able to answer follow-up messages, not just the first response. This gives you deeper insight into your agent efficiency and customer experience than First Response Time alone.
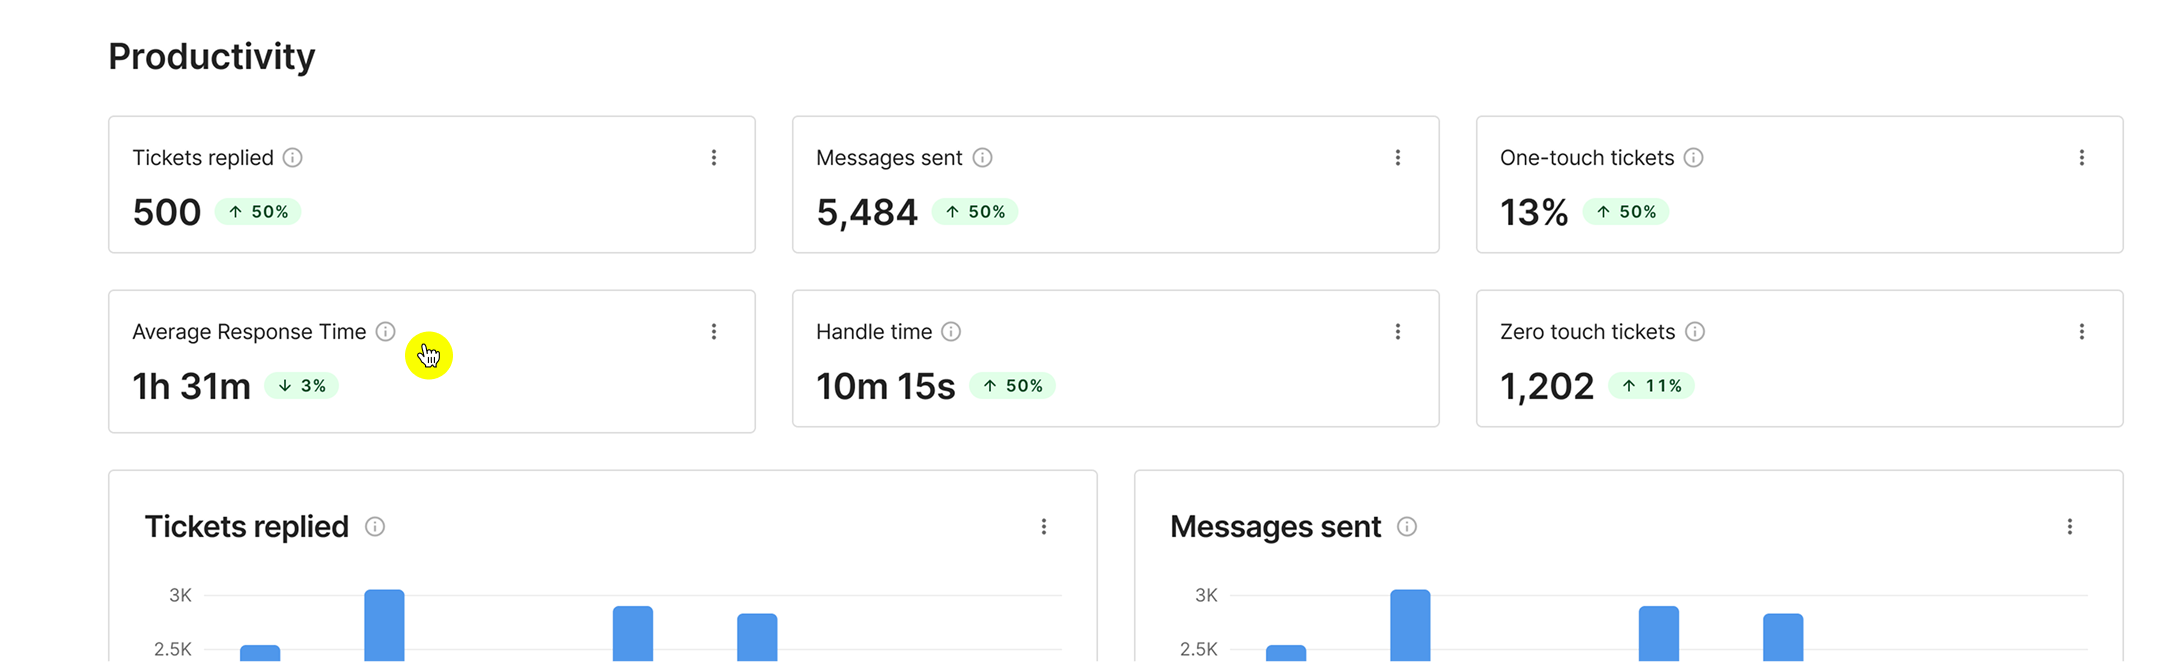
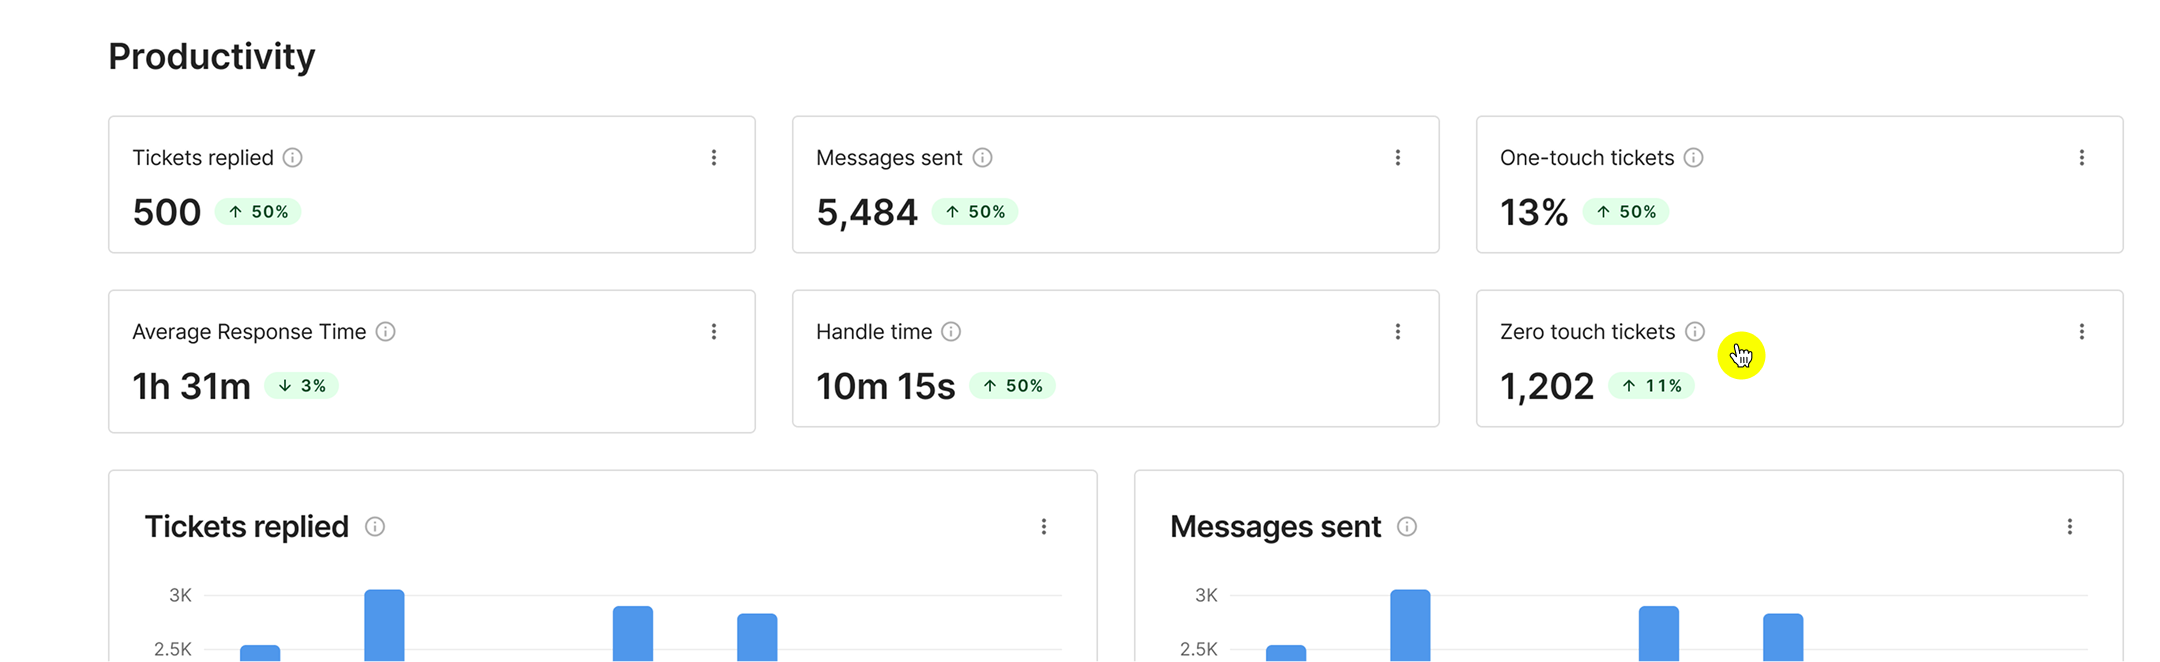
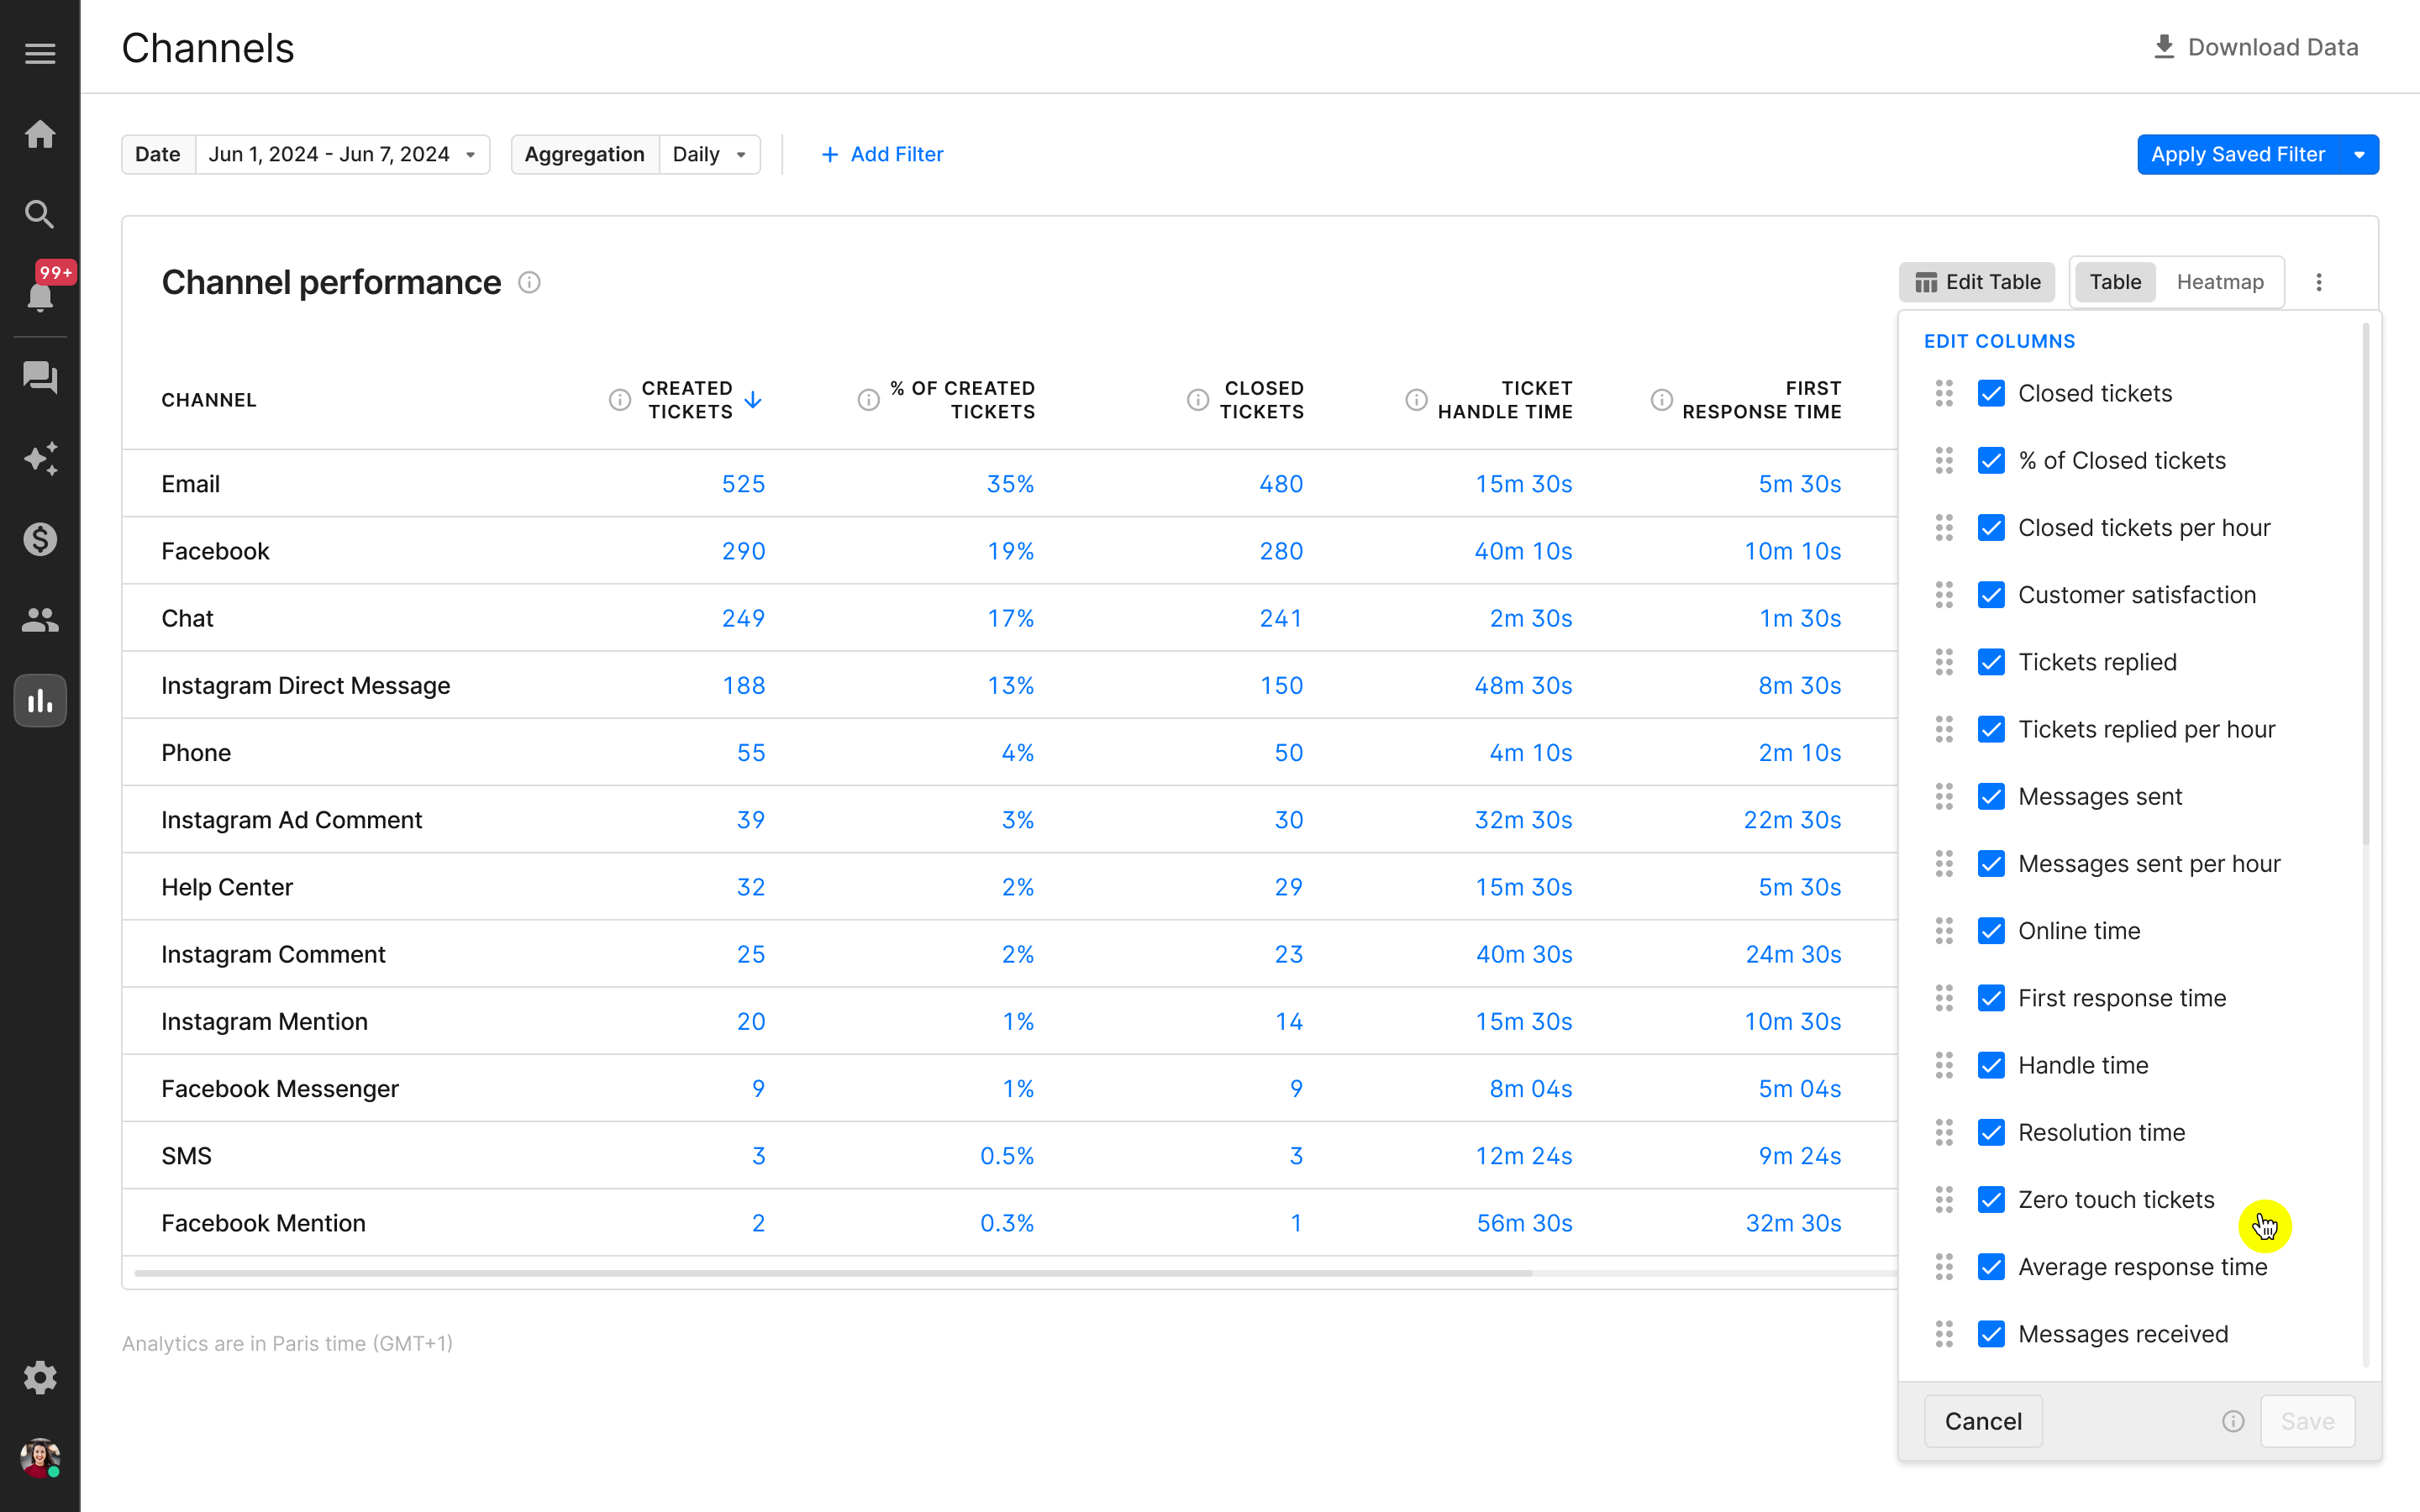
Zero-touch tickets: Understand how many of your agent’s closed tickets didn’t actually require a response. This helps you understand what % of your closed tickets in a given period actually require a response, to give you a better sense of workload. Tickets closed by the auto-close spam rule count toward this total.
In addition the the Support Overview report, these metrics are available in the Agents report as well as the Channels report. You can toggle them on and off (along with other metrics) by clicking Edit Table.
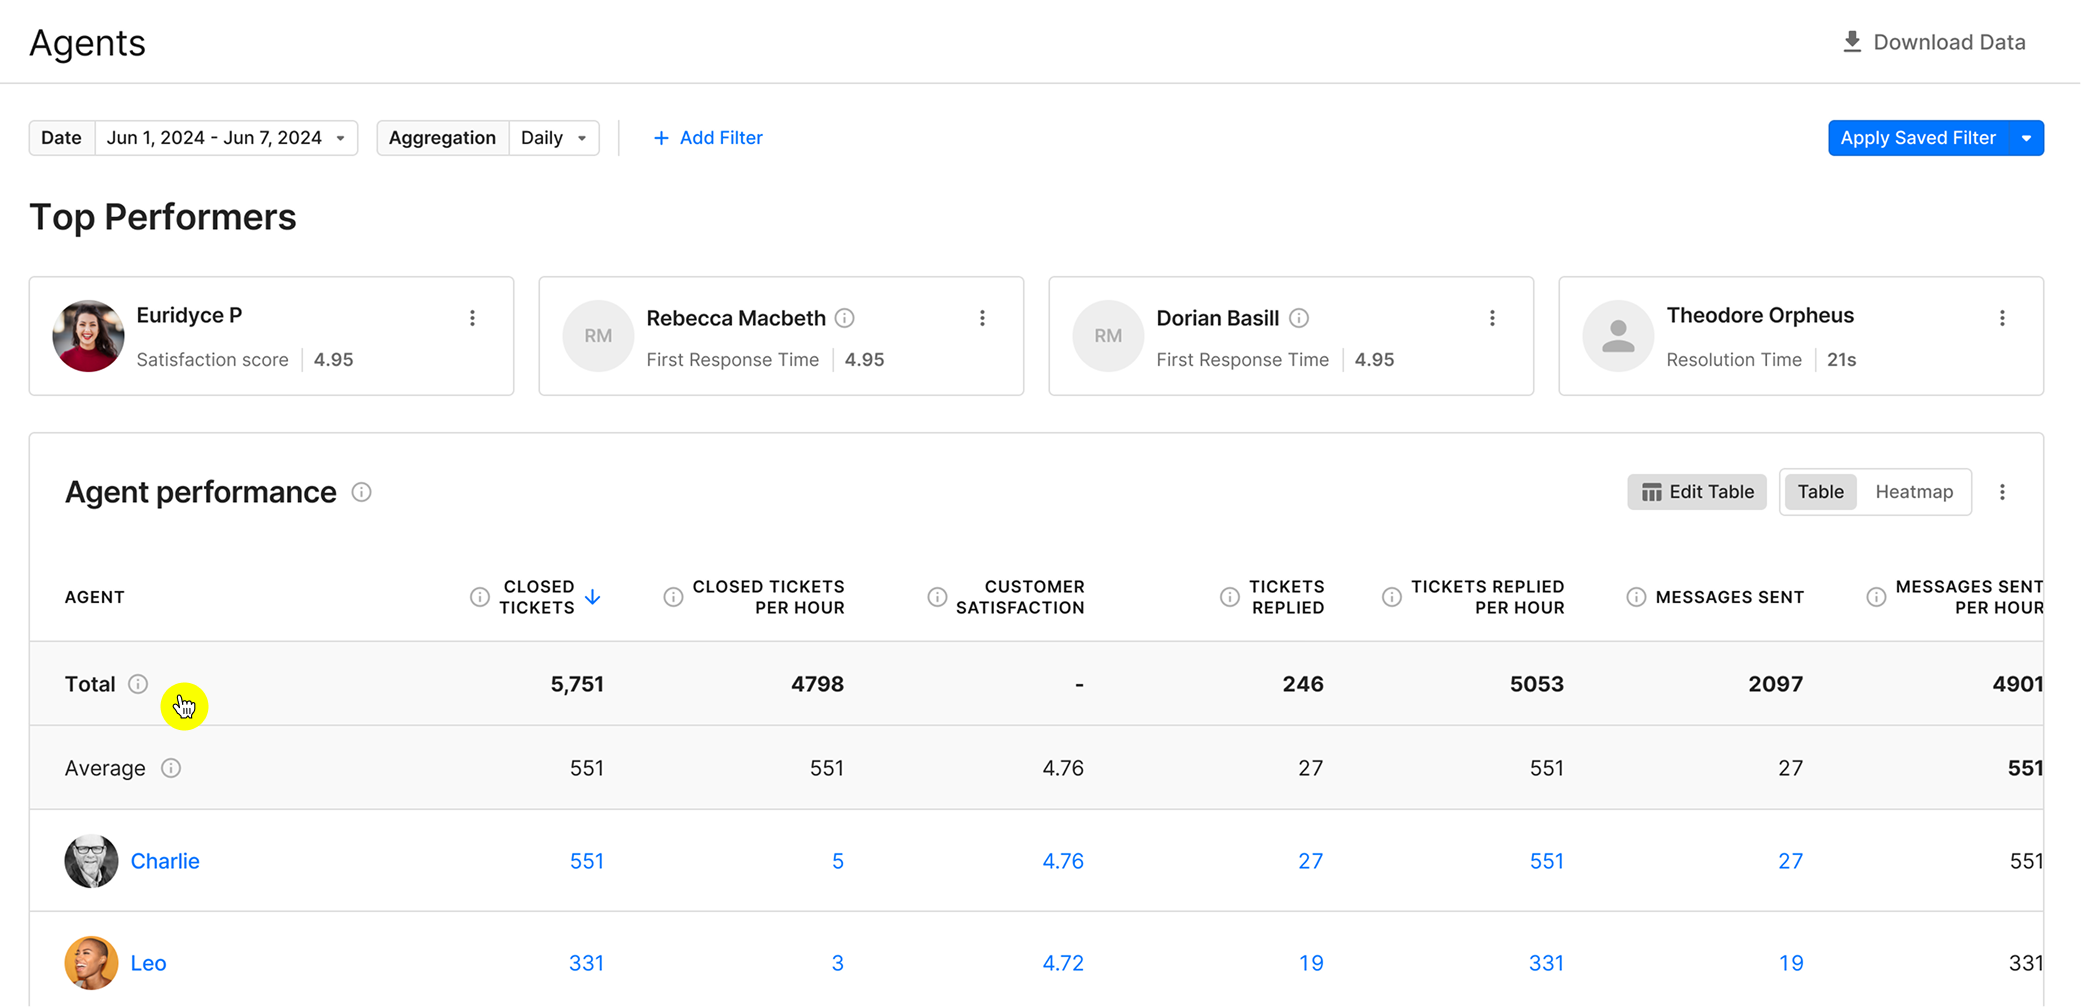
See “Total” amounts in the Agents report
In the Agents report, you can now see Average values, Total values, or both. This gives you more ways to see the total workload and metrics across all your agents, helping you understand staffing needs and overall performance.
These updates come on the heels of other improvements to our reporting solutions. If you haven’t yet, take advantage of the following releases to up-level your reporting:
Did you like this update?
![]()
![]()
![]()
Leave your name and email so that we can reply to you (both fields are optional):