Statistics redesigned 📊
1523046960001
Improvement
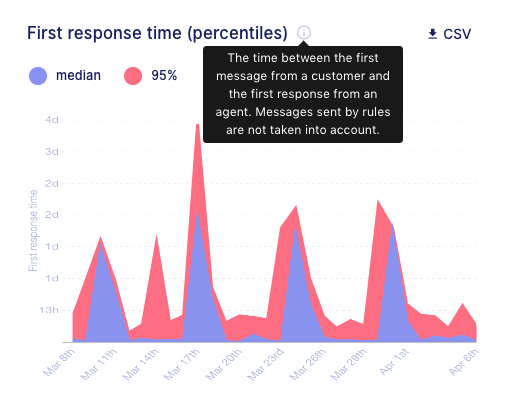
We’ve made a lot of small improvements to make statistics easier to read for you.
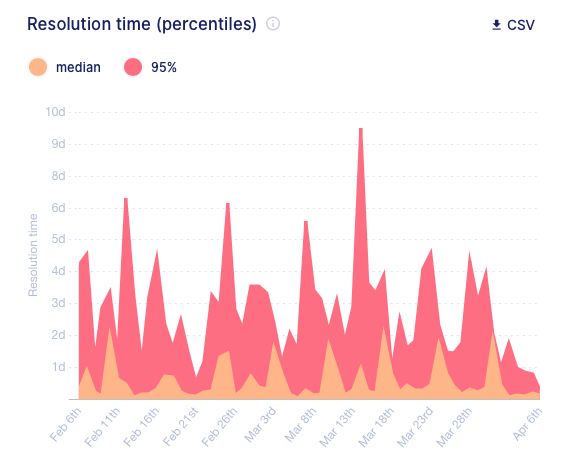
Also, each graph has now its own definition so you can understand how it is calculated.
Published by Louis Barranqueiro