Ticket Fields Report
1697560382872
Ticket Fields Report — your new tool for effortless data analysis, empowering you to gain valuable insights and track their evolution over time.
Get a concise high-level insights with Ticket Fields Report
The Ticket Fields Report is an intuitive dashboard designed to:
Provide concise high-level insights and trends regarding your Ticket Fields dropdown data.
Identify areas for potential improvement.
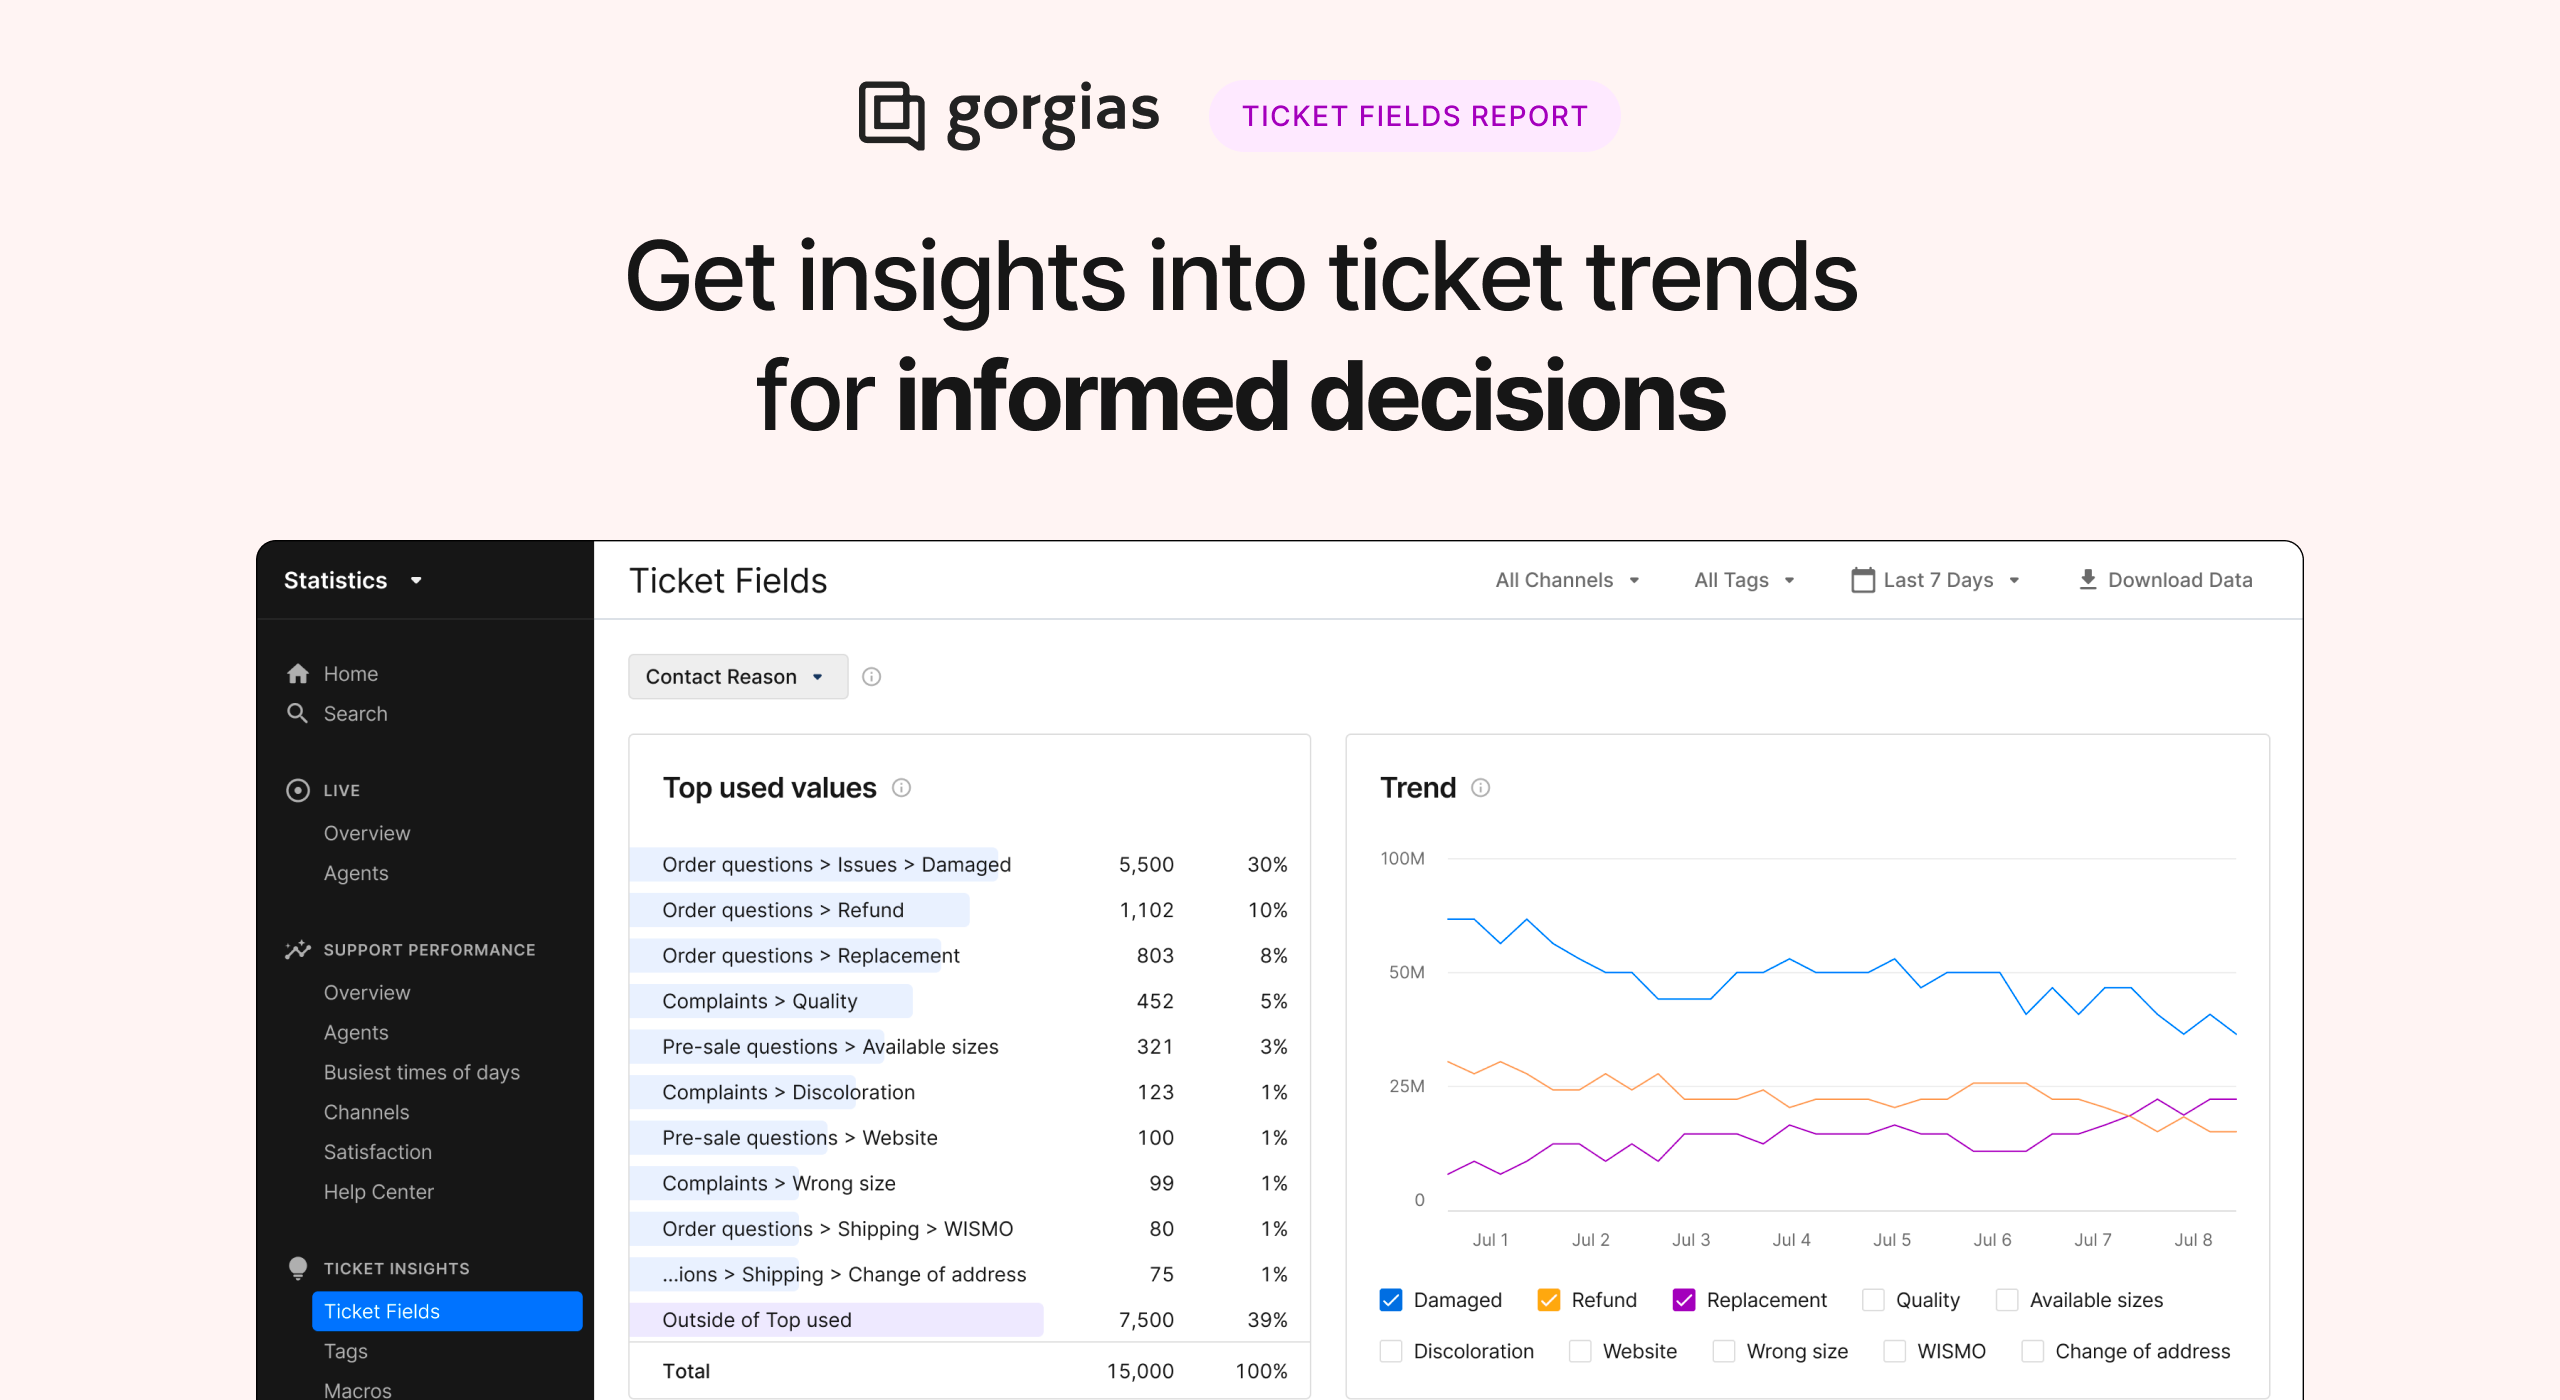
This report gives you an overview of the most frequently used values within a specified Ticket Field and how they have evolved over time. Additionally, it provides a comprehensive breakdown of all values utilized during the selected time frame.
With this report, you can gain insights into any of your Ticket Fields categorized as "dropdown." All you need to do is choose which one to display.
Improve how you compare business performance over time
To help you get started, we've organized the dashboard into three sections:
Top Used Values: Identify the top 10 values that have been used. This allows you to discern the most common value and assess the distribution of top issues compared to all issues.
Trends: Observe the top 10 values used during the selected period and their progression over time. This helps you understand how the most prevalent contact issues or product preferences evolve.
All Used Values: Examine the "All Used Values" table to view all values used, categorized by time period. This enables you to identify the most common groups or final values related to contact reasons and/or products.
We hope this reporting dashboard helps you get more out of Ticket Fields!
Did you like this update?
![]()
![]()
![]()
Leave your name and email so that we can reply to you (both fields are optional):