Streamline and customize reporting with Dashboards!
timestamp1740418051658
As a CX leader, you regularly pull reports on support KPIs, agent performance, and trends.
These metrics have existed in Gorgias — but pulling them for weekly reporting used to mean jumping between multiple reports, reapplying filters each time, and struggling to export everything into one clean report.
Not anymore. With Dashboards, you can build and save up to 10 custom dashboards that track your key KPIs, channels, and trends—all in one place.
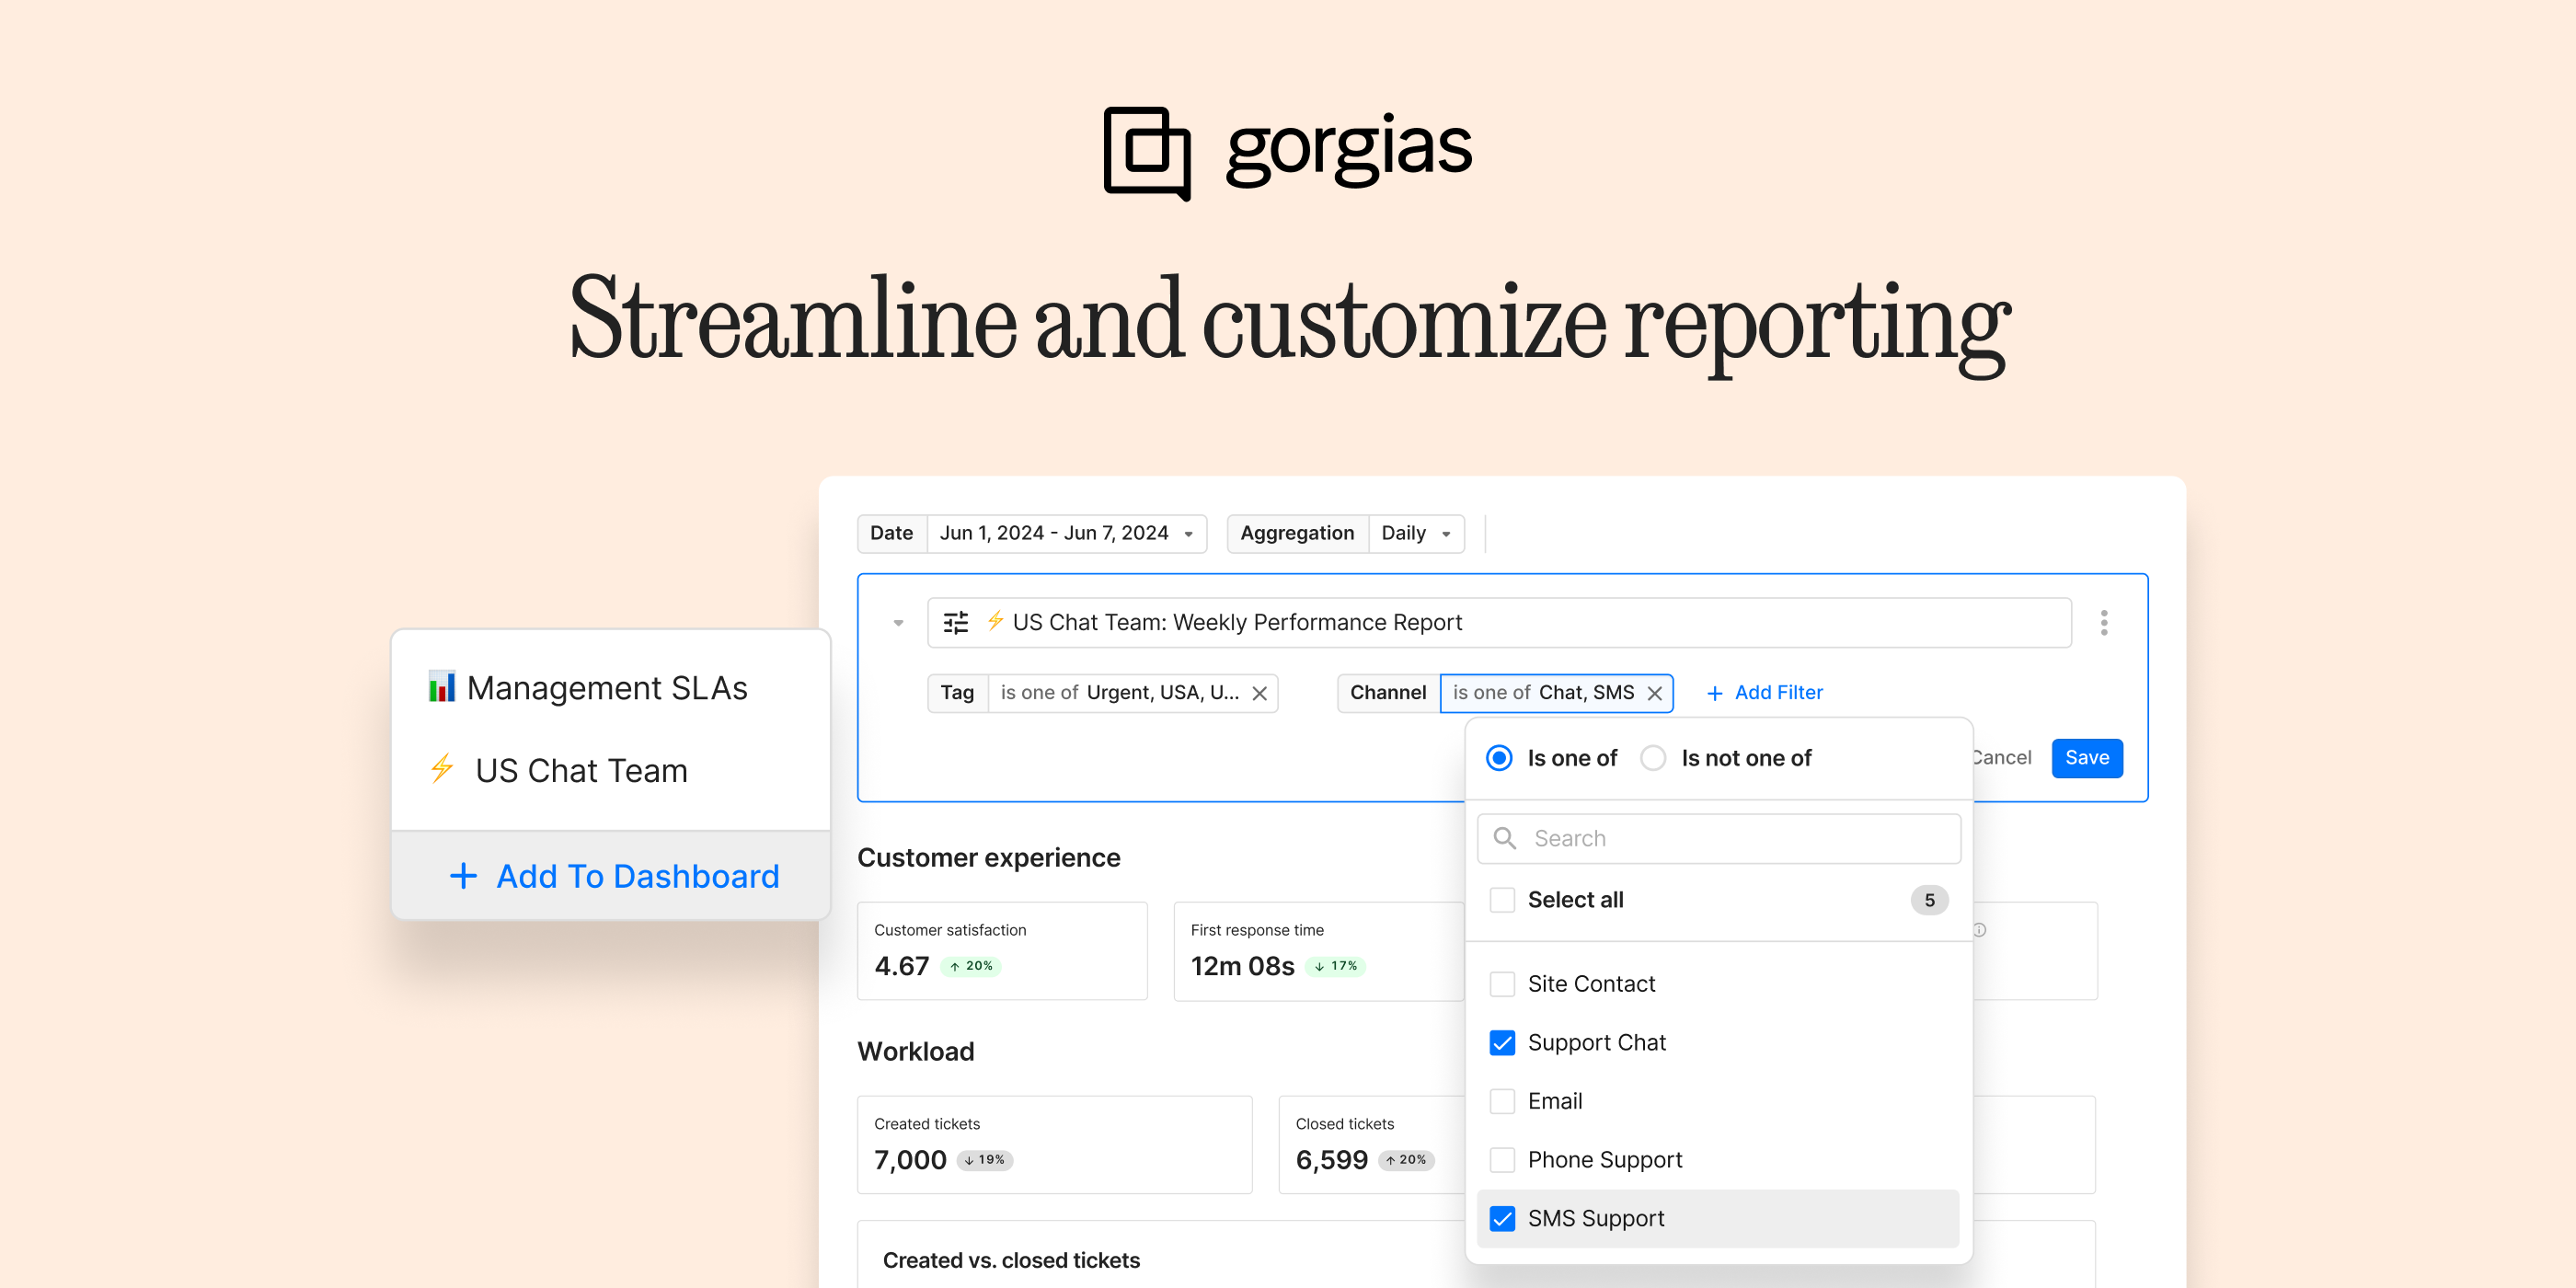
✅ Save time & effort: No more jumping around and re-applying filters. Build reports once and revisit them anytime.
📊 See what matters: Apply filters to drill down on specific channels, contact reasons, teams, and more.
📈 Data at a glance: Assemble key metrics and visualizations however you like, with insights at the top.
📥 One clean export: Export KPIs, charts, and tables in CSV format to share with teams and feed into other tools.
What do dashboards look like?
Here’s an example of a Dashboard, Performance and insights on Chat:
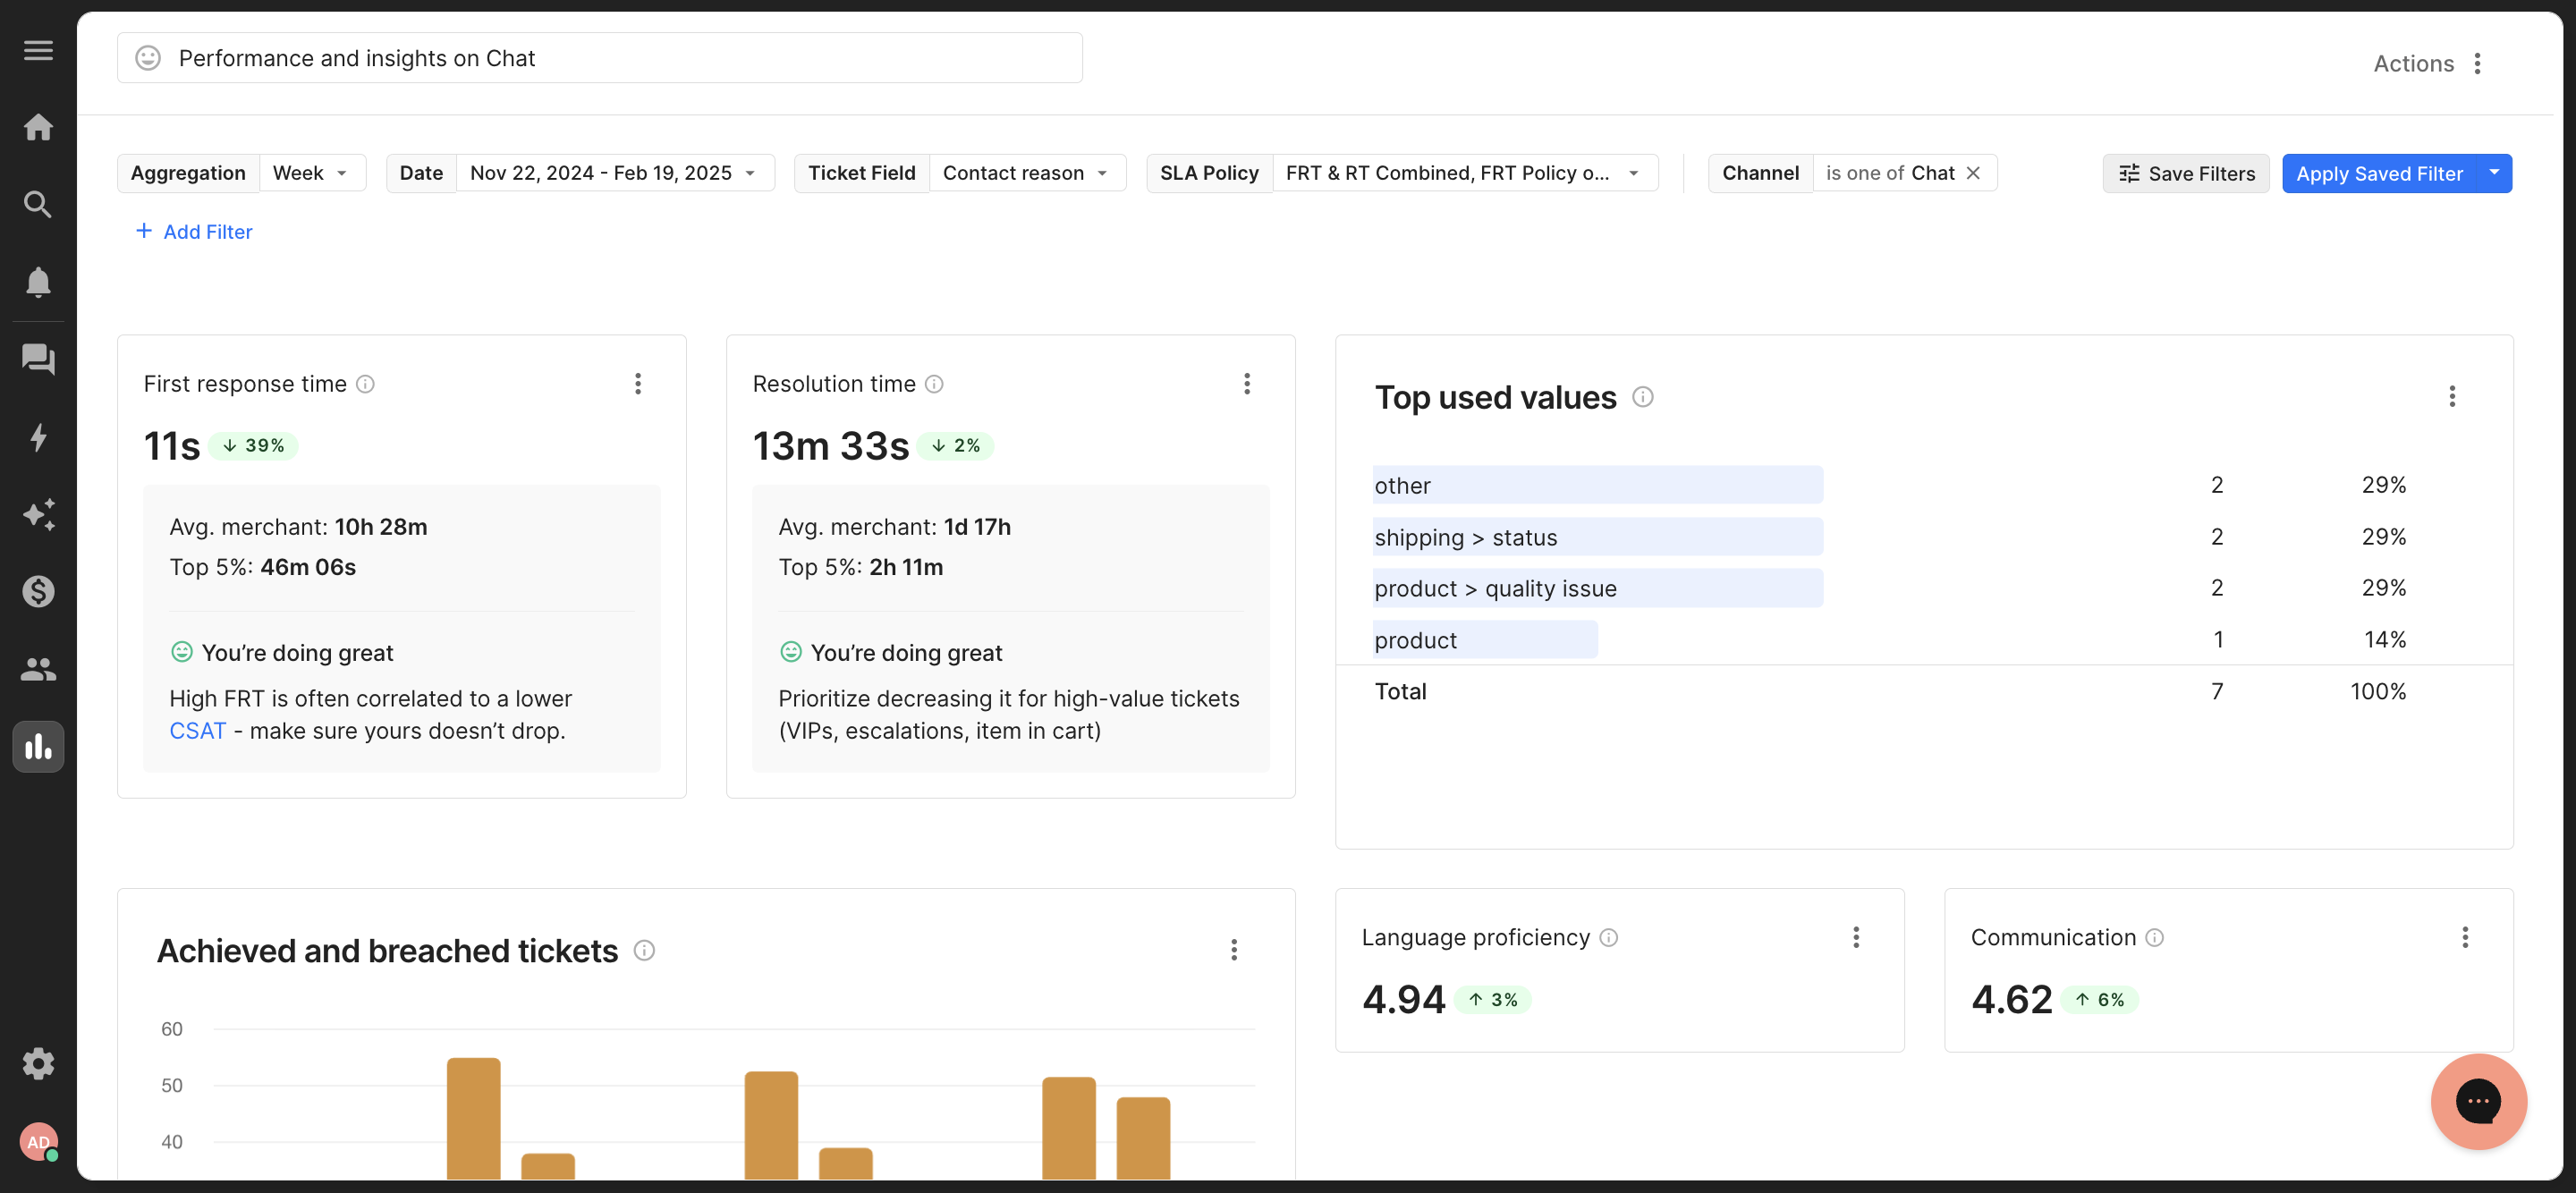
The Dashboard consolidates reports around:
KPIs: First Response Time and Resolution Time (pulled from Support Overview)
Conversation insights: Top used values (pulled from Ticket Fields report)
SLA: Active vs breached tickets (pulled from SLA report)
Response quality: Language proficiency and Communication score (from the AutoQA report)
How to get started
Log into Gorgias and head to Statistics > Dashboards. Click the + button to create a new Dashboard.
Start your Dashboard: Create a Dashboard around your use case, whether that’s weekly reporting on a specific channel or a monthly agent performance report. Remember, Each user in your team can create up to 10 reports with the metrics, tables, and charts you need.
Add Charts & Data: Click “Add Chart” to pull charts from other reports in Gorgias (including metrics, bar charts, tables, and more). You can arrange them however you like.
Filter Your View: Apply filters to focus on key data and save filters for quick reuse.
Download Your Data: Export reports as CSV files for easy sharing and analysis.
Check out our Help Doc about Dashboards for assistance along the way!
Did you like this update?
![]()
![]()
![]()
Leave your name and email so that we can reply to you (both fields are optional):