New Support Performance Overview (beta)
1685658672739
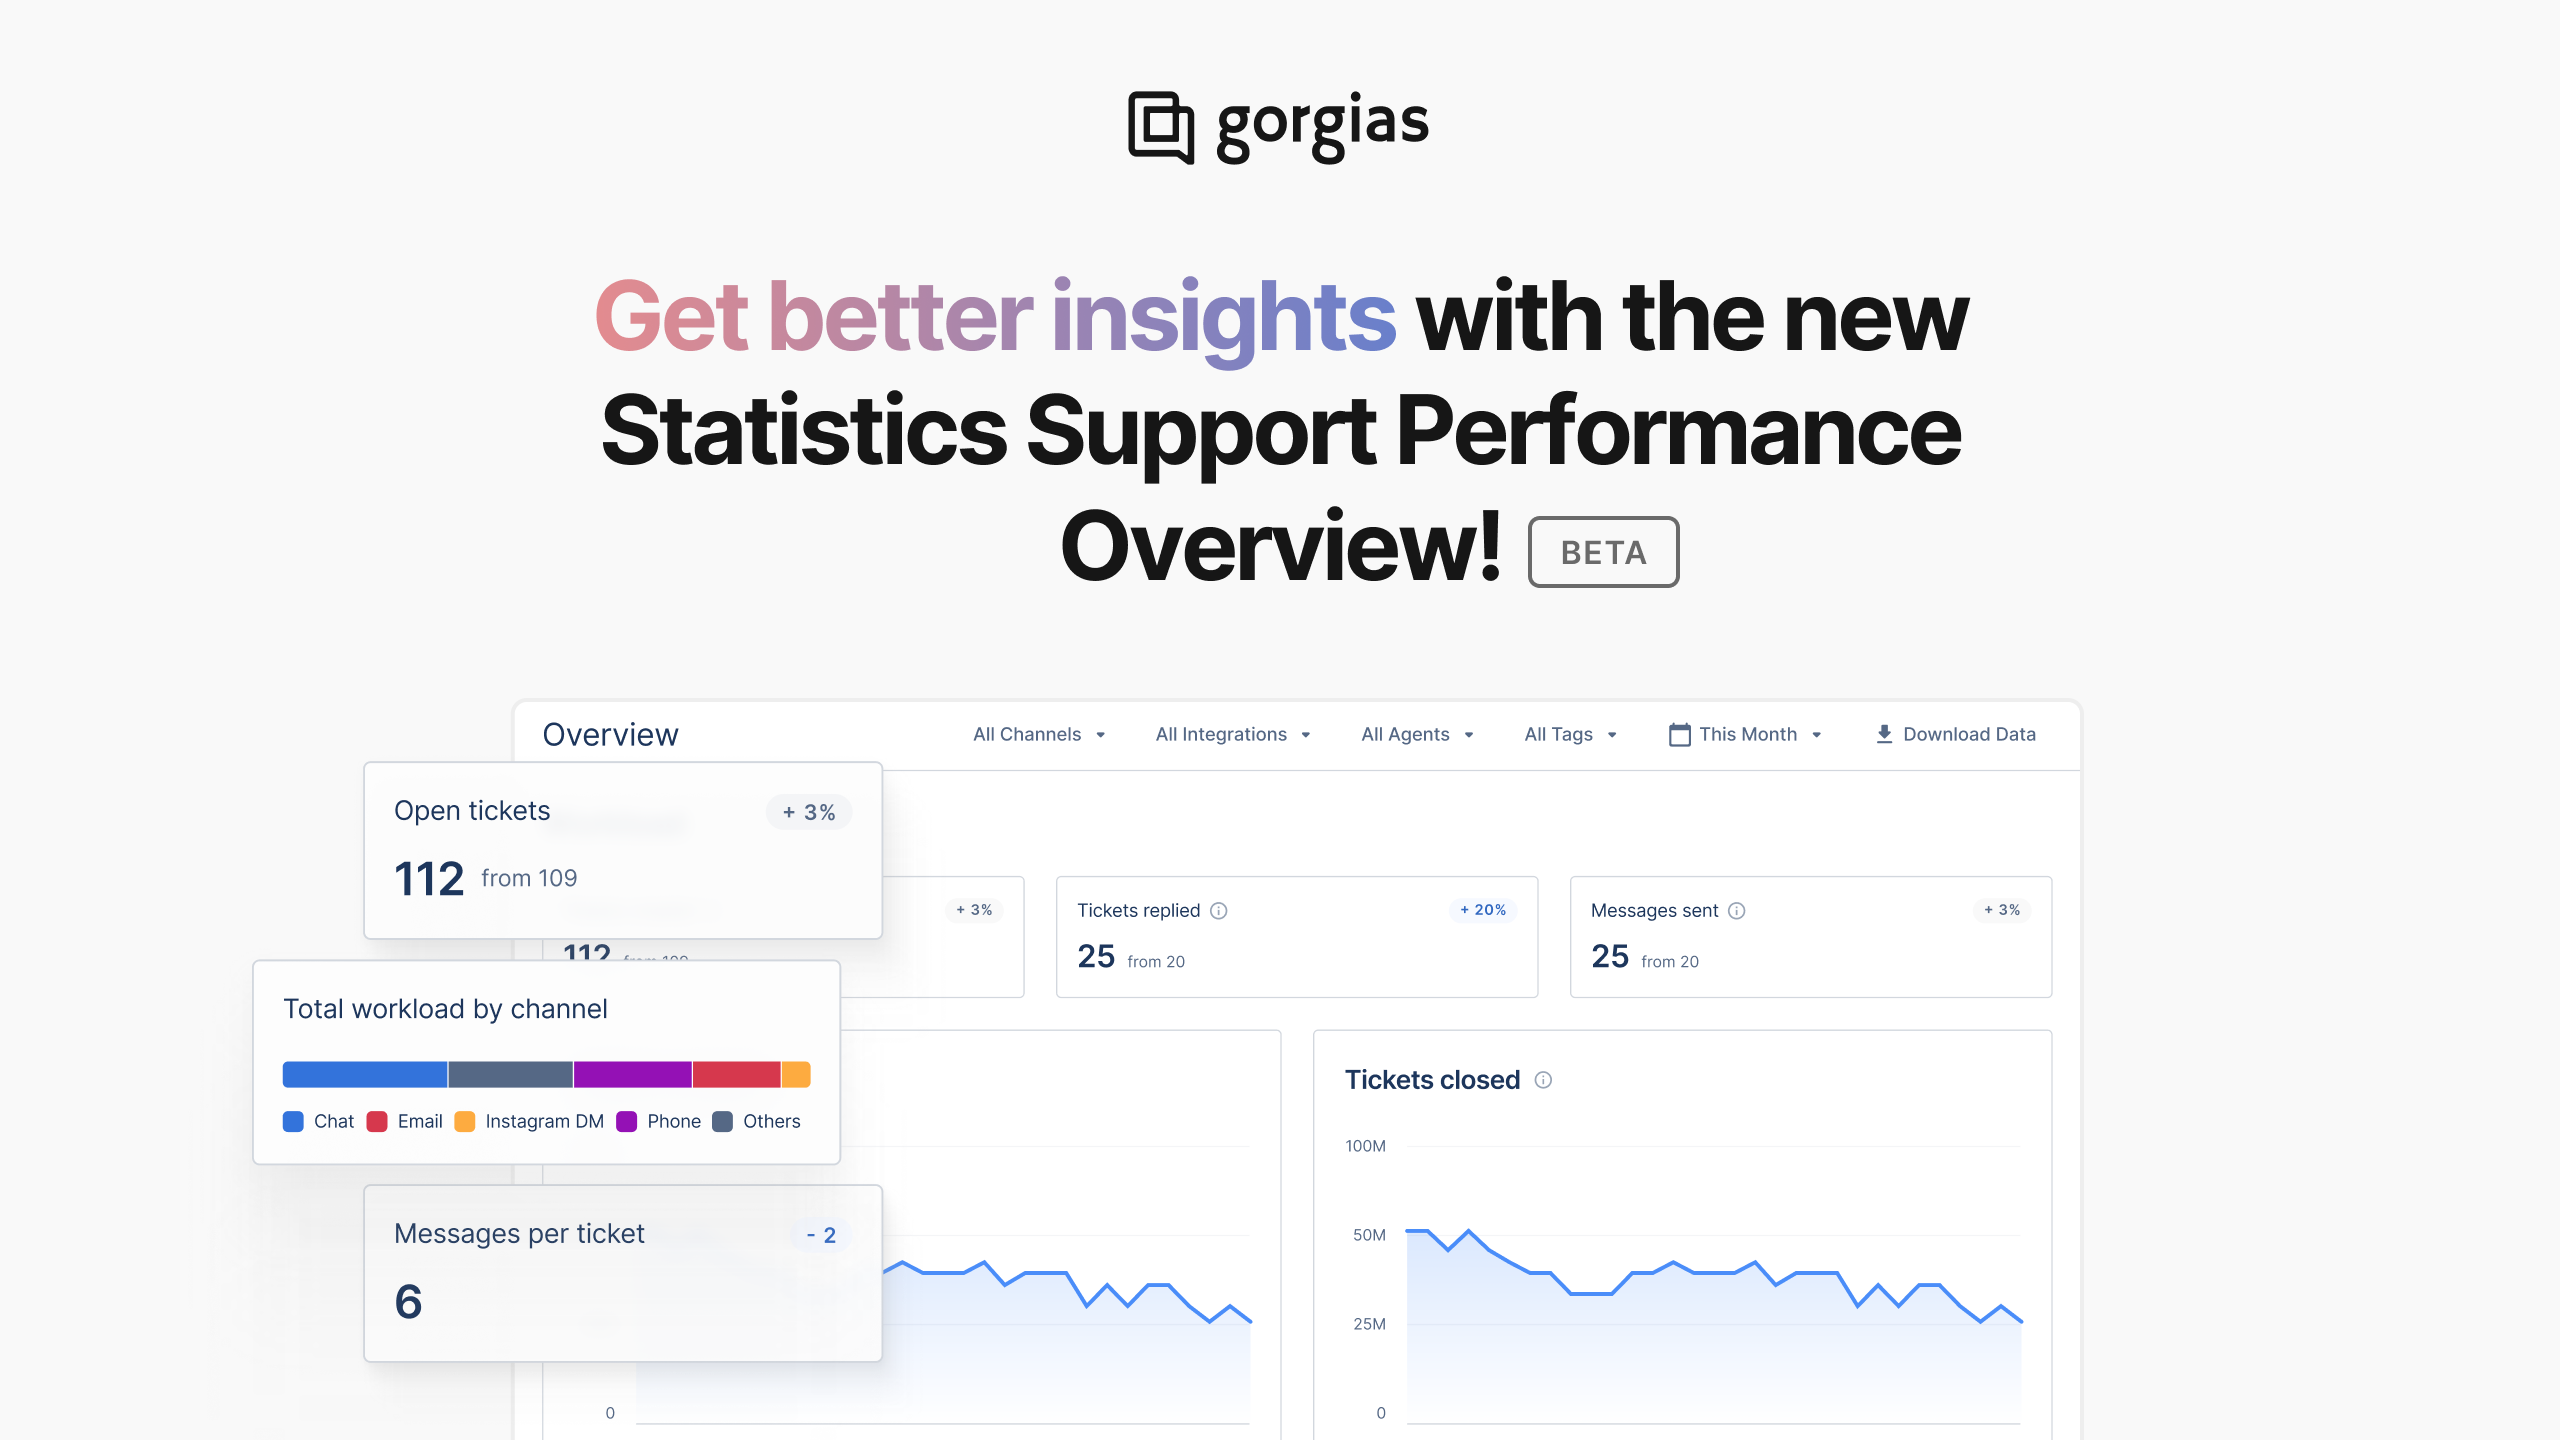
We are happy to announce that the new Statistics Overview page is live in beta. Thanks to this page, you will gain even more actionable insights about your CX at a glance!
Optimize the customer experience based on their perspective
Easily visualize all the metrics that represent the quality of support shoppers receive, from CSAT to First Response Time. Use them to align expectations, generate insights, and increase revenue by providing better service.
Improve how you compare business performance over time
Our data calculations have been updated to provide more accurate insights into your bottom lines, so you can continue improving your business. You can now analyze historical data for up to a year and keep track of your analysis without losing ticket history.
Spot opportunities to optimize your workforce
Determine whether your team is handling the workload or if changes need to be made. For example, you can estimate the workload by analyzing the ticket backlog at the end of a given timeframe using the new Open Tickets metric, among other new metrics.
To learn more, check out our documentation!
What comes next
In the near future
We are collecting feedback to improve the report, and are already working on adding the tags filter as well as adding an export to CSV feature.
Longer-term
This is just the beginning as we are progressively replacing all the dashboards using our new data stack to provide you with the dreamy analytics suite that you have been asking for. Some of the future improvements you can be looking forward to include a report dedicated to agent and team performance, ticket fields over time, average handle time, historical online time among many other metrics!
Did you like this update?
![]()
![]()
![]()
Leave your name and email so that we can reply to you (both fields are optional):