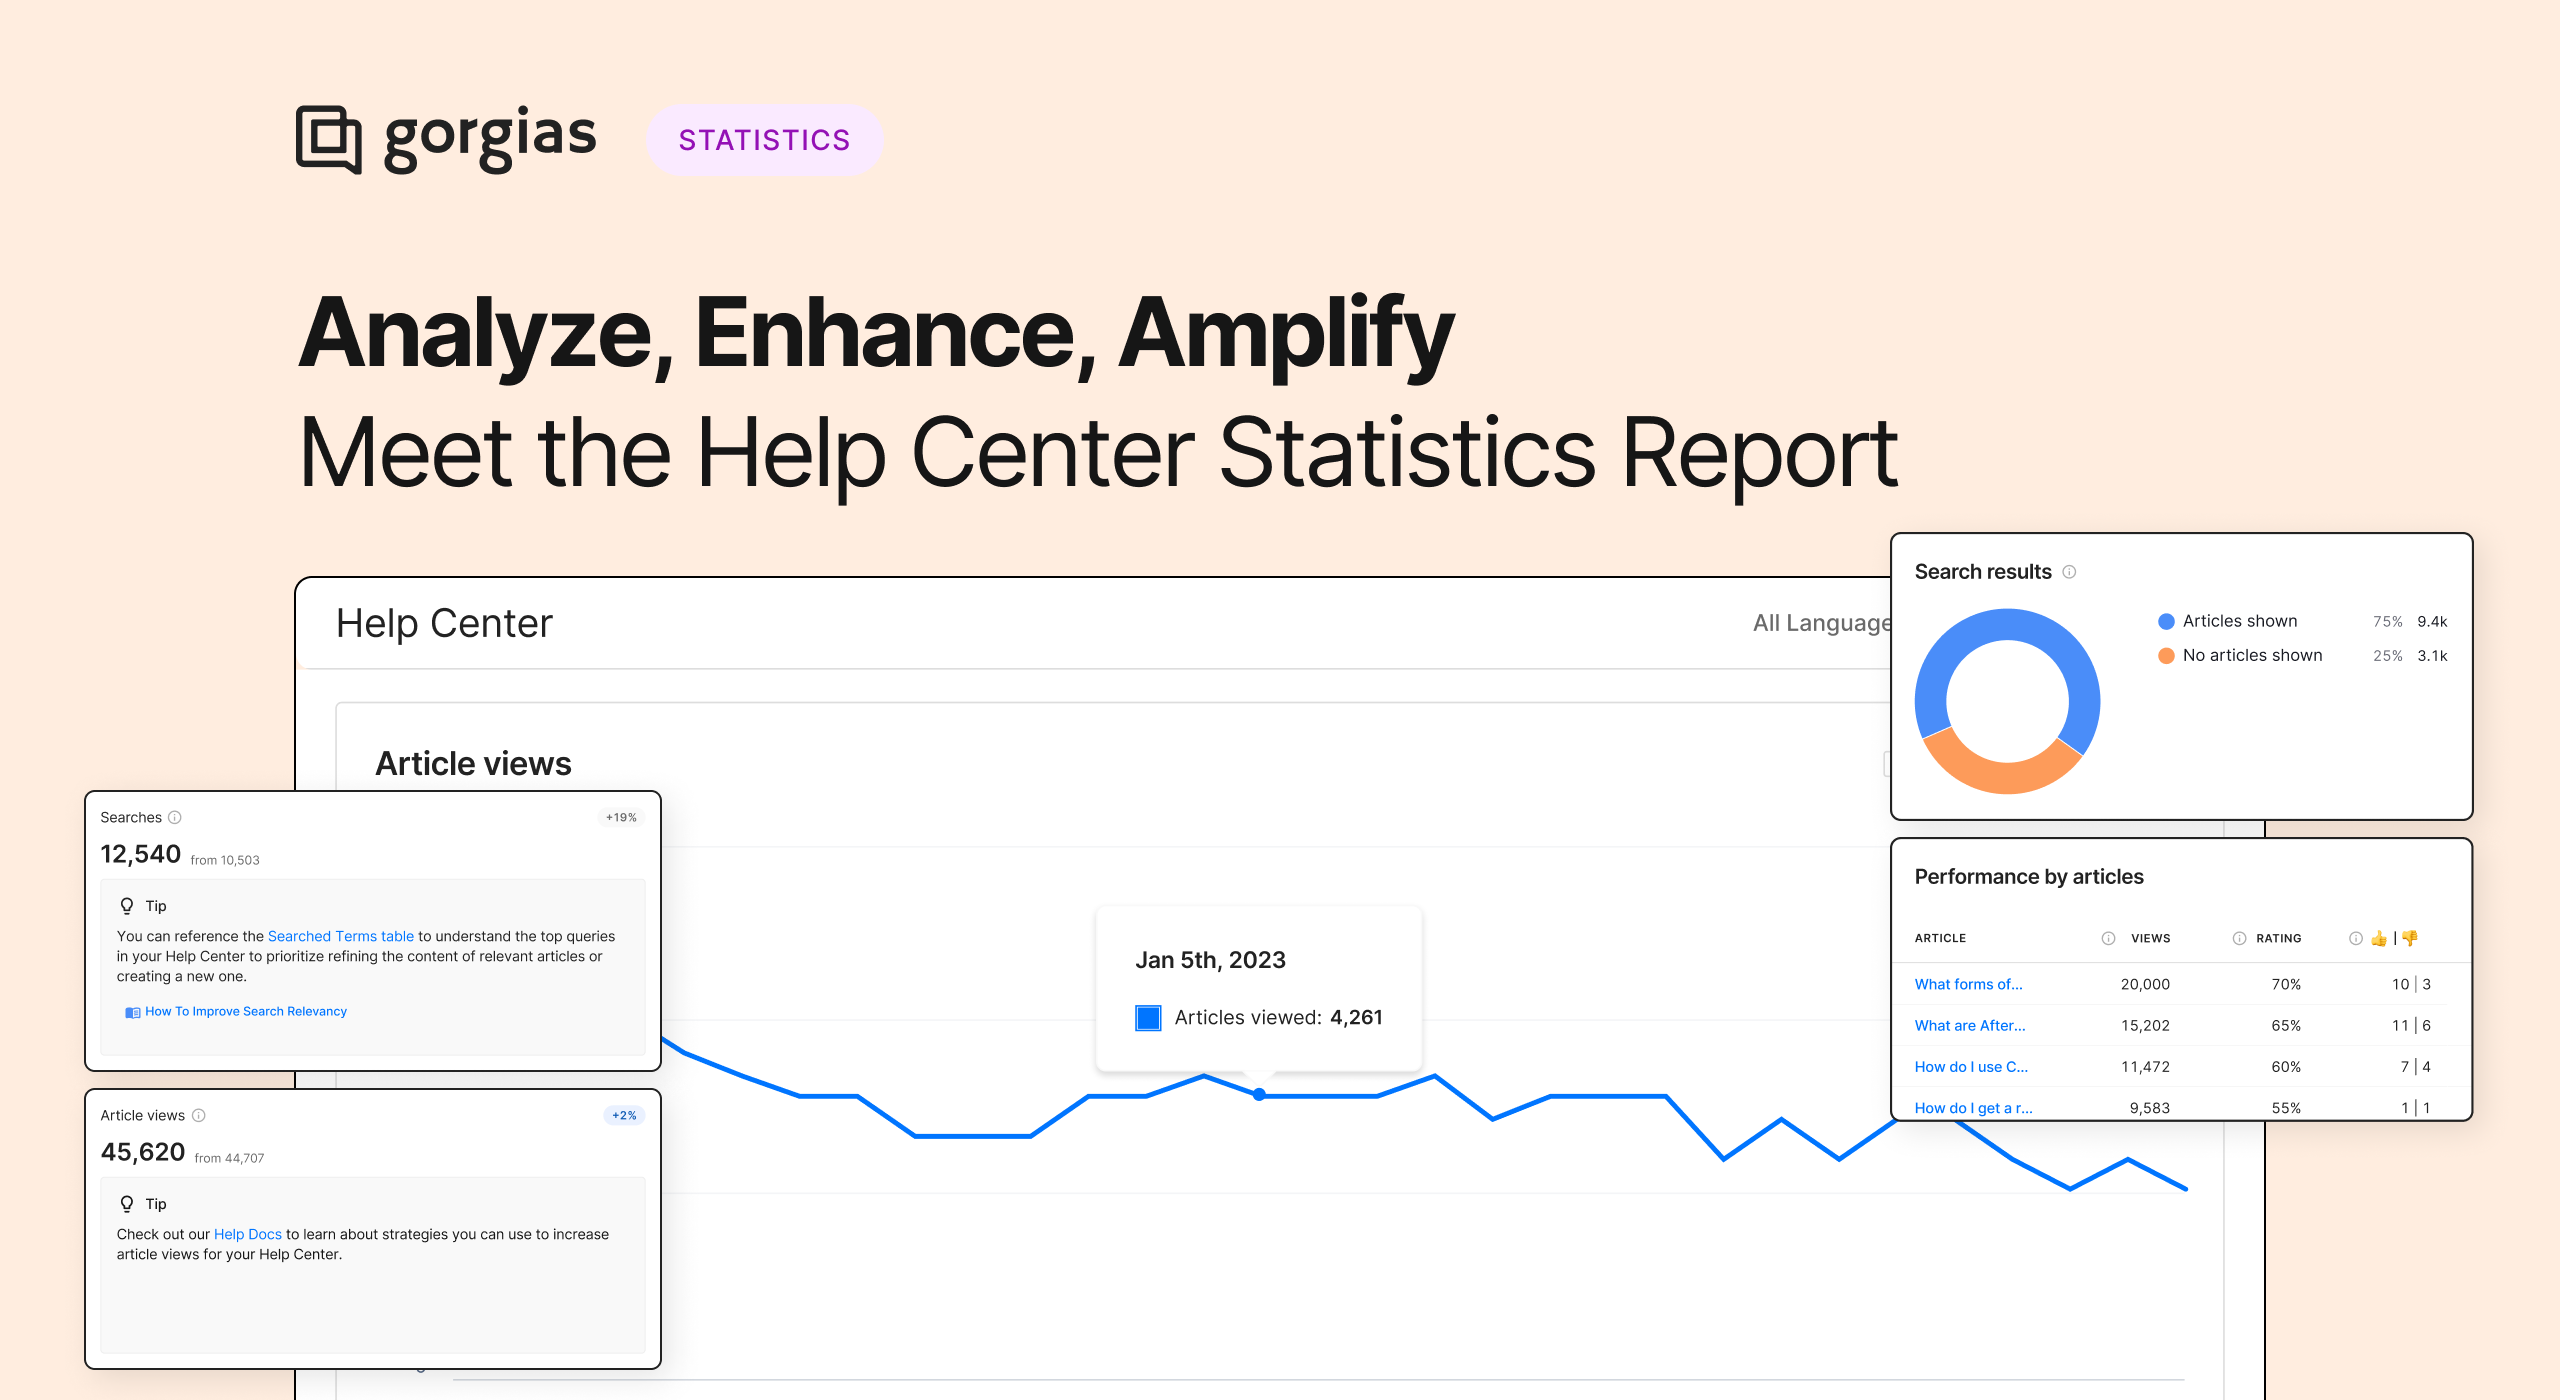
💫 Meet the new Help Center Statistics Report
1703163182947
Before the year wraps up, we've got something special for you. We're excited to introduce a big update that's all about making your Help Center even better. Whether you’ve already published your first article or just starting to explore its potential, we've got something valuable for you and your customers.
Here are some interesting facts to kick things off: Did you know that 88% of consumers now expect companies to have a self-service support portal? And here's the kicker: 79% of customers are already using Help Centers for their support needs.
It's pretty clear that Help Centers are in high demand, and it's not just about reducing support ticket volume, it's about providing your customers with round-the-clock assistance. Now, you might be wondering, what's the secret sauce to unlocking the full potential of your Help Center?
Drumroll, please! 🥁
Introducing the brand-new Help Center Statistics Report. This is where the magic happens, Gorgias-style. 🎩✨
What is the new Help Center Statistics Report?
Think of it as your backstage pass to the inner workings of your Help Center. The Help Center Statistics Report is designed to offer you deep insights into your Help Center’s performance. It consolidates all the insights you've been searching for in a single, comprehensive report. This unified report will empower you to level up your content, explore popular search trends, and make well-informed, data-driven decisions to enhance the entire customer experience.
What can you use this report for?
👉🏼 Analyze your article performance
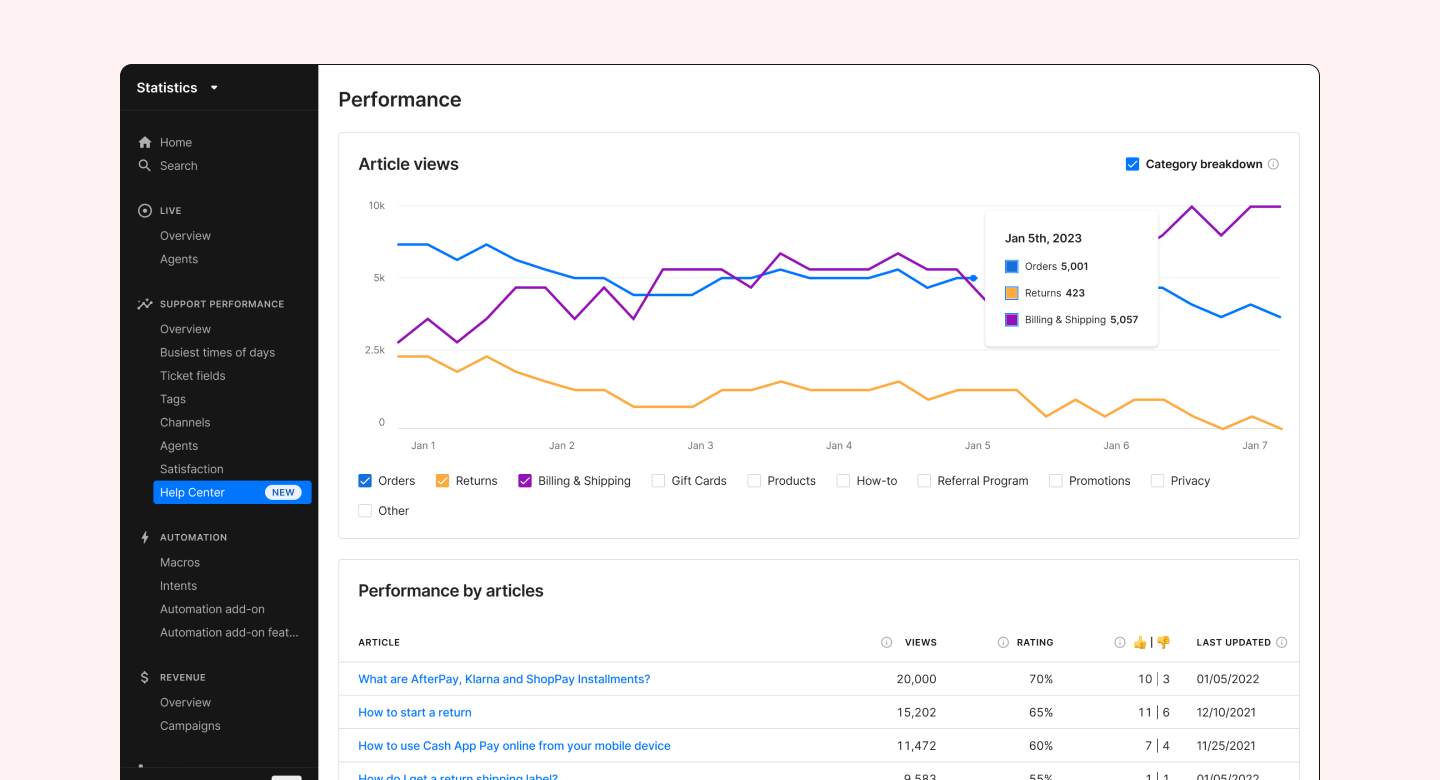
With this report, you can:
Delve into the performance of your articles by category over time.
Analyze key metrics such as the total number of views, ratings, and reactions.
And much more.
👉🏼 Analyze Help Center searches
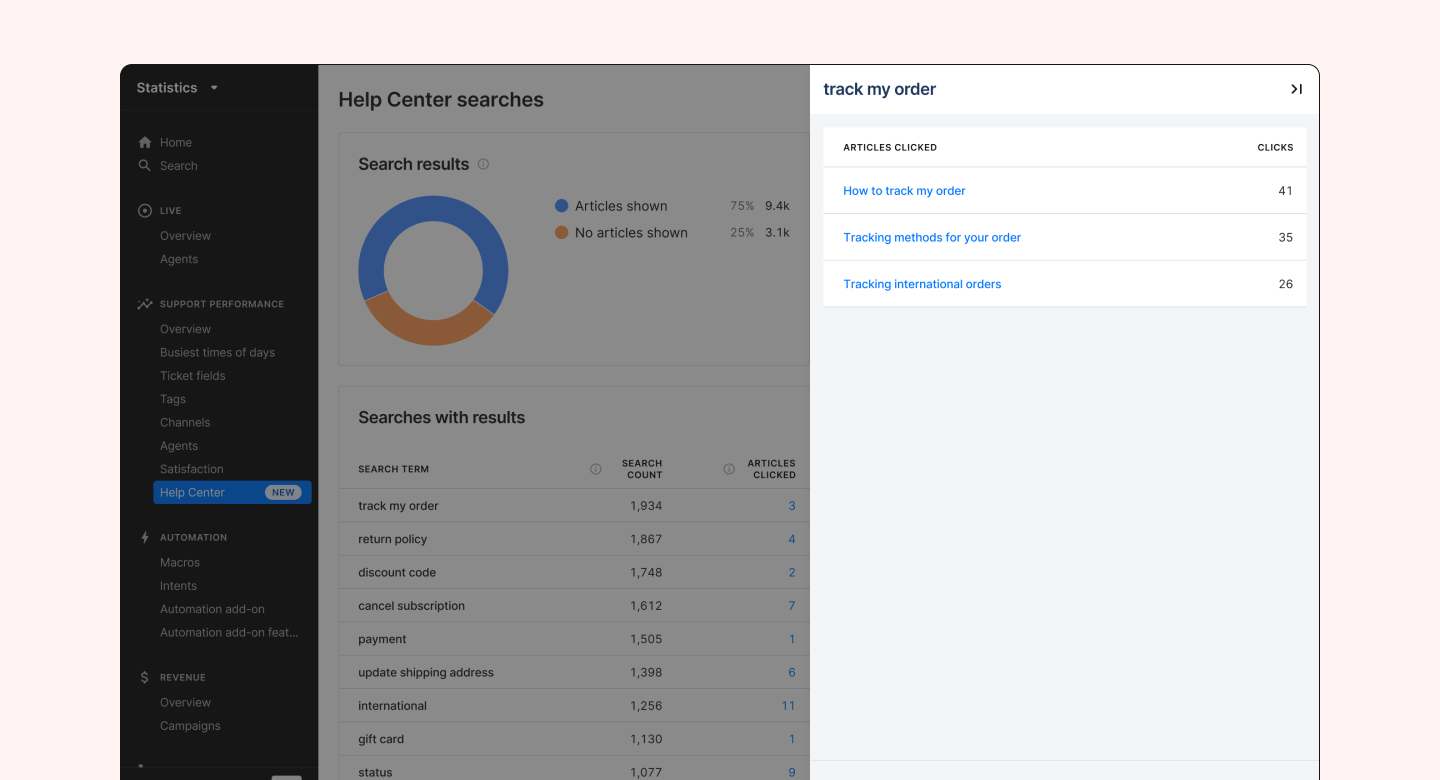
This report empowers you to:
Uncover emerging trends in user search behavior to help you create content that resonates, highlight new topics of interest, and meet ever-evolving user needs.
Identify important metrics like Click-Through Rate,search Count, and even discover untapped search terms that could significantly benefit your strategy.
👉🏼 Assess user engagement and receive benchmark tips
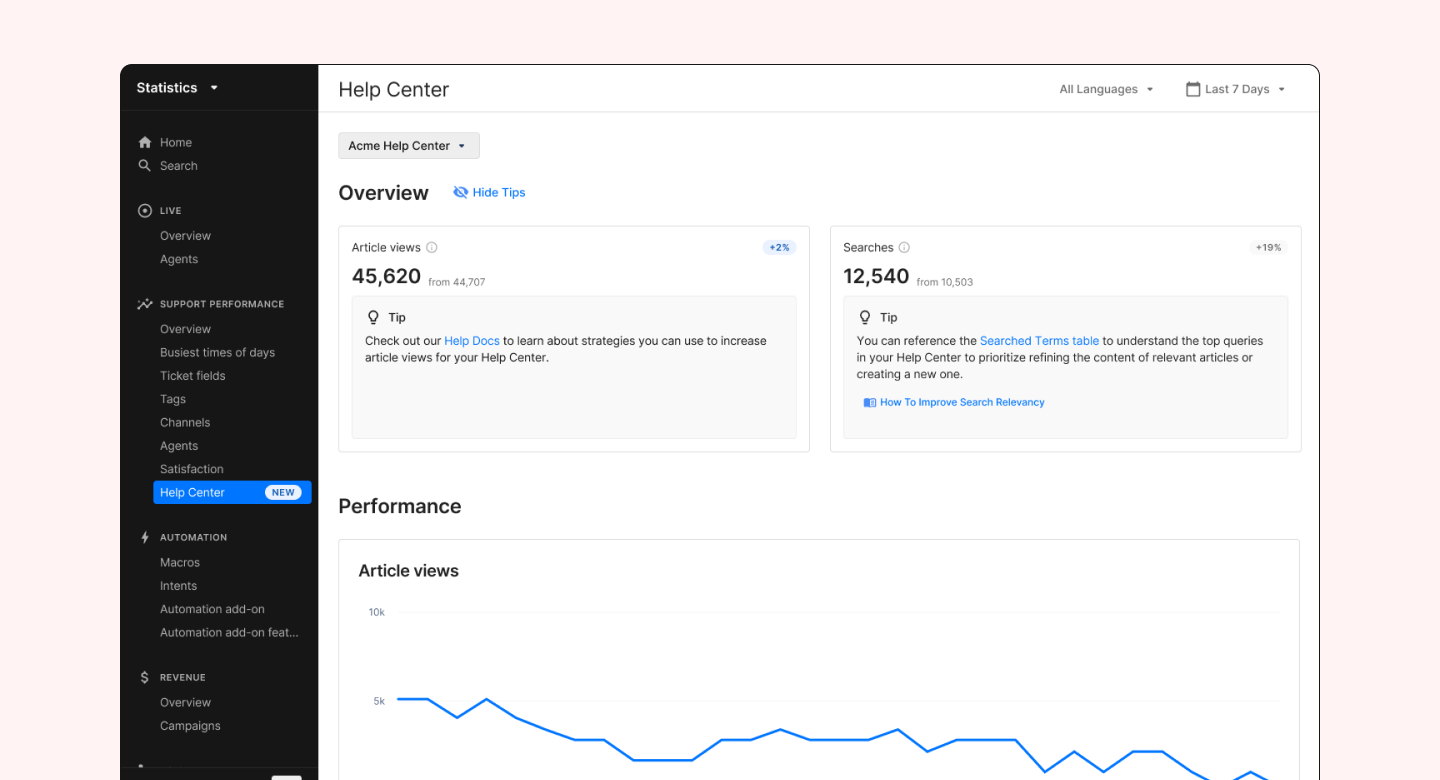
Here are some things you can expect to find:
Identify popular content using the total article views metric.
Gain insights into the most common topics or questions users are searching for, thanks to the Searches metric.
Receive valuable benchmarking insights from other top merchants, allowing you to enhance key metrics.
Why use the Help Center Statistics Report?
🌟 Enhance Help Center Effectiveness: Identify popular and underperforming articles and categories to deliver a better customer experience.
💰 Ticket Deflection: For Gorgias Automate subscribers, quantify how self-service resources save your budget by allowing customers to find solutions on their own.
🚀 Faster Optimizations: Rapidly improve your Help Center by addressing areas that generate the most support tickets and enhancing the user experience.
📊 Efficient Content Management: Prioritize popular search terms to enhance accessibility and relevance.
👉 Minimize Ticket Volume: Direct customers to self-service solutions, effectively reducing support ticket volume.
📈 Industry Benchmark: Gain insights into performance and make informed content decisions through industry benchmarking.
Get started with the new Help Center Statistics Report
Already have a Help Center and want to understand the metrics and make the most out of reporting? Explore our helpful documentation here.
Don't have a Help Center for your brand yet? Get started with our step-by-step guide here.
Not a Gorgias Automate subscriber and interested in automating your Help Center even further? Let’s chat!🤩 Schedule a demo with us to learn more.
Did you like this update?
![]()
![]()
![]()
Leave your name and email so that we can reply to you (both fields are optional):