Improved metrics in Gorgias Statistics
1694512468316
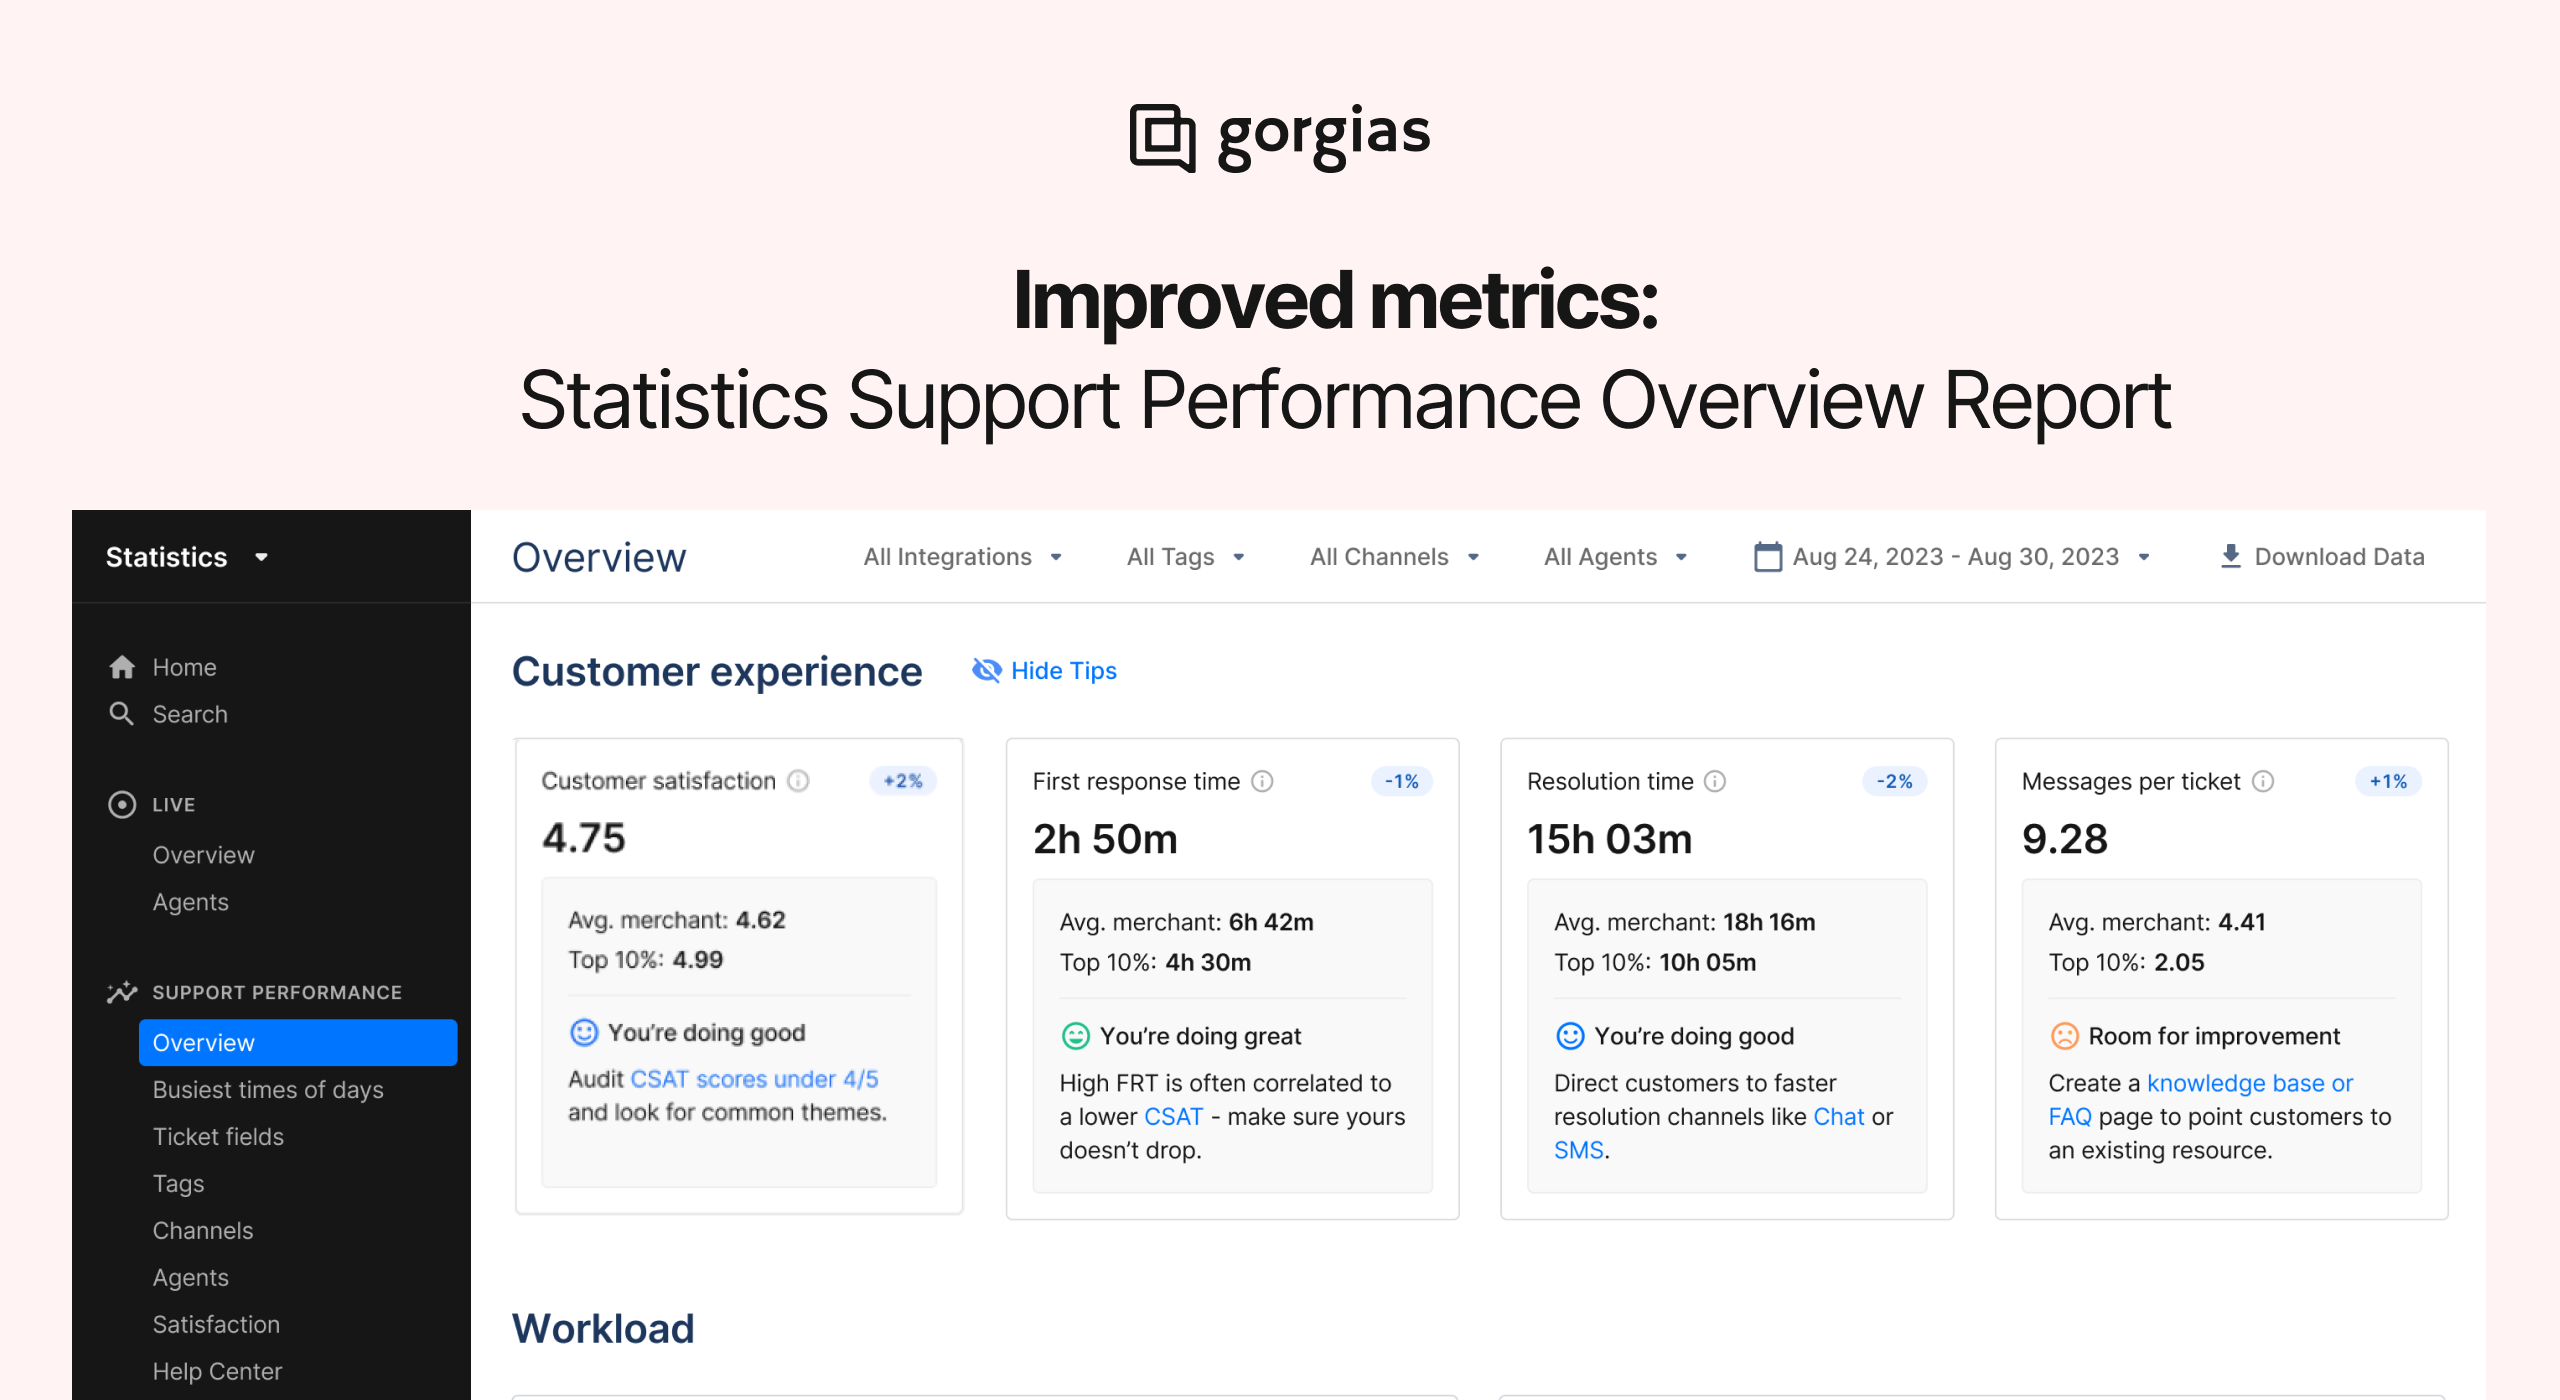
We're here to share some important changes we've made to the Support Performance Overview report, based on user research and customer feedback. These updates aim to enhance your experience and provide clearer insights. Let's delve into the details:
💡Performance Tips with updated benchmarks
Why We Made This Change:
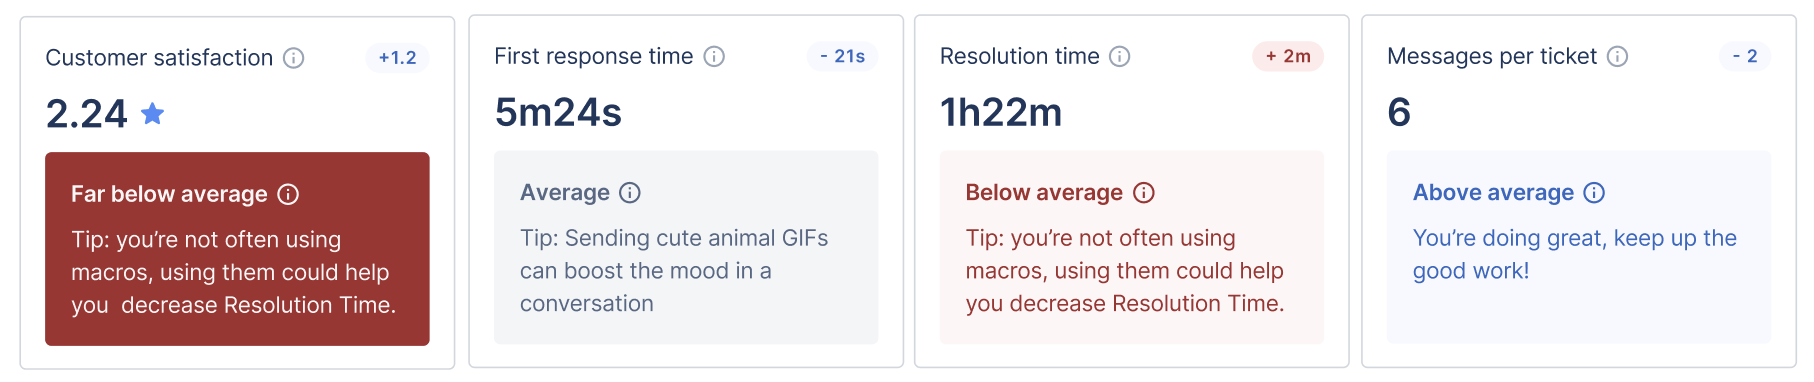
As a result of the previous design, we received a variety of feedback from users who found the way we provided the tips confusing.
❌ Before
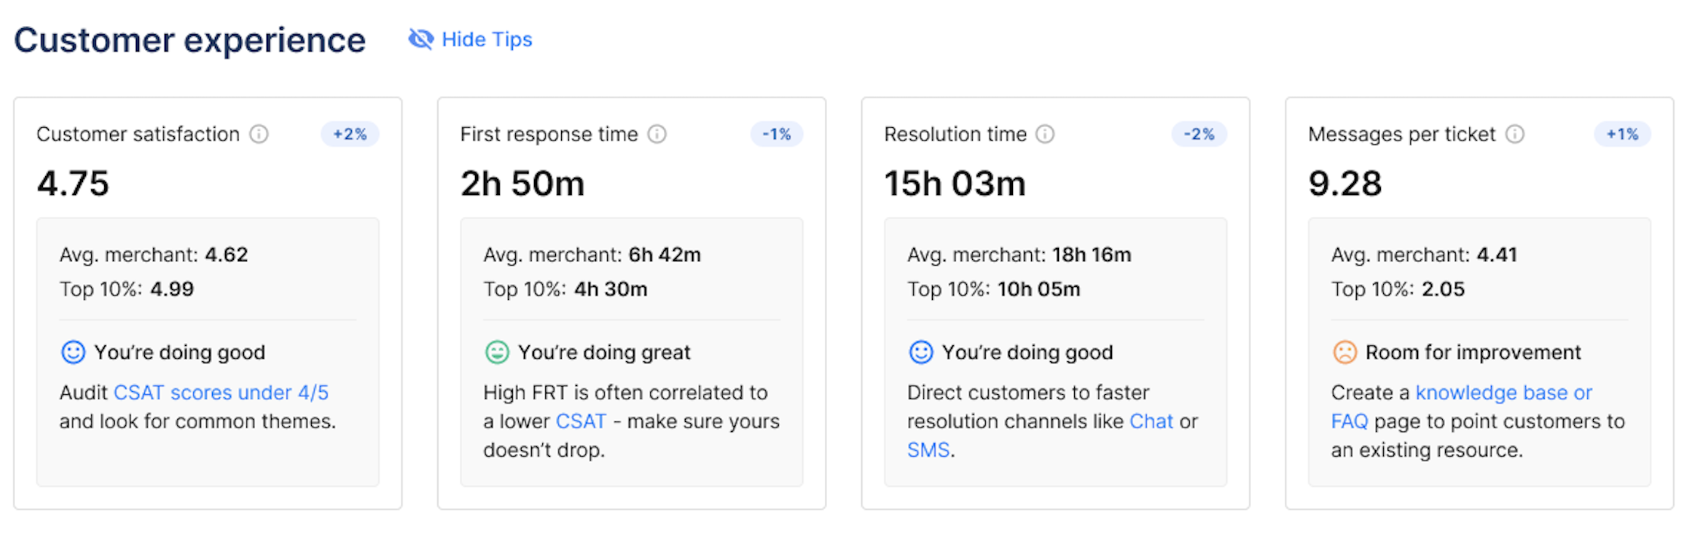
✅ Now
What We've Changed:
Our previous tips have been overhauled to provide you with new insights, and our scale has been simplified to make it easier for you to use. This change makes it considerably simpler for both you and your team to grasp. Also, when you hover over the metrics, you'll find a handy tooltip that explains how these numbers come to life.
Here's the scoop:
The average and top 10% are calculated using data from Gorgias customers on the same plan. Please bear in mind that this calculation doesn't take your specific industry or channel into account.
We directly compare your live data with the monthly average performance of other merchants who share your plan.
This approach ensures that the comparisons and tips provided are laser-focused on your plan and resources.
So, what's the metric breakdown now?
You're doing great 😃: in the top 10% of merchants
You're doing good 🙂: between the average and 90% percentile
Room for improvement 🙁: below the average
💡Change in "Ticket Created" Agent Filter Logic
Why We Made This Change:
To improve user experience and make filtering actions more user-friendly, we wanted to provide a clearer picture of how many tickets a particular user has created within a specific period.
What We've Changed:
Previously, when you selected agent(s) in the agent filter, the "ticket created" number represented the tickets created during the period and assigned to the agent at the end of that period. Now, we've updated it so that when you select agent(s) in the filter, the "ticket created" number shows all the tickets created by the selected agents during the period.
How does it work, and what is the impact?
If you want to know how many tickets were created by agents during the period, simply select all agents.
If you're interested in the number of tickets created by customers, you can easily calculate it by subtracting the total tickets from those created by agents.
Suppose you want to get the total number of tickets created during the selected period, specific to a team, regardless of who initiated the conversation. In that case, we recommend using rules to auto-tag those tickets and then using the tag filters in the stats (without selecting the team/agents). That will show the total number of tickets created for a particular team within the selected timeframe, whether a customer or an agent submitted them.
We hope these changes make your experience with our Support Performance Overview report even better! If you have any questions or feedback, please feel free to reach out.
Did you like this update?
![]()
![]()
![]()
Leave your name and email so that we can reply to you (both fields are optional):